My Web Game Was Fast Locally. Its Public WebSocket Took 469 ms.
I investigated a report of slow gameplay on November 6. The local service answered requests, but that wasn’t enough to explain what someone experienced through the public address.
I compared the local and public paths before changing game code. The difference was large enough to change the investigation. I didn’t have a frame-rate result that explained the complaint, and I didn’t have evidence for a server restart.
The measurements below belong to that investigation. I haven’t rerun them as a current performance benchmark.
The short path and the public path
I measured four HTTP requests on each path and fifteen application-level WebSocket ping/pong exchanges. The latter used the game’s existing WebSocket endpoint without creating a game room.
| Measurement | Local path | Public path |
|---|---|---|
| First HTTP request | 23.7 ms | 1,324.7 ms |
| Second HTTP request | 1.7 ms | 491.4 ms |
| Third HTTP request | 1.0 ms | 488.3 ms |
| Fourth HTTP request | 0.8 ms | 1,847.6 ms |
| WebSocket round-trip range, 15 exchanges | 0–1 ms | 452–1,959 ms |
| Public WebSocket median | — | 469 ms |
Every HTTP request in that table returned 200. Success didn’t mean the wait was short. The fourth public request was slower than the first, so I can’t describe all later requests as a stable half-second baseline.
The local zeros are rounded measurements, not a claim of literally zero latency. The public median is one observation from fifteen exchanges. I haven’t converted it into an internet-wide service guarantee.
This distinction cost me a simple answer. “The server responds” was true, but it didn’t address the reported wait. I’d have been debugging the wrong layer if I’d stopped there.
The tunnel wasn’t the whole journey
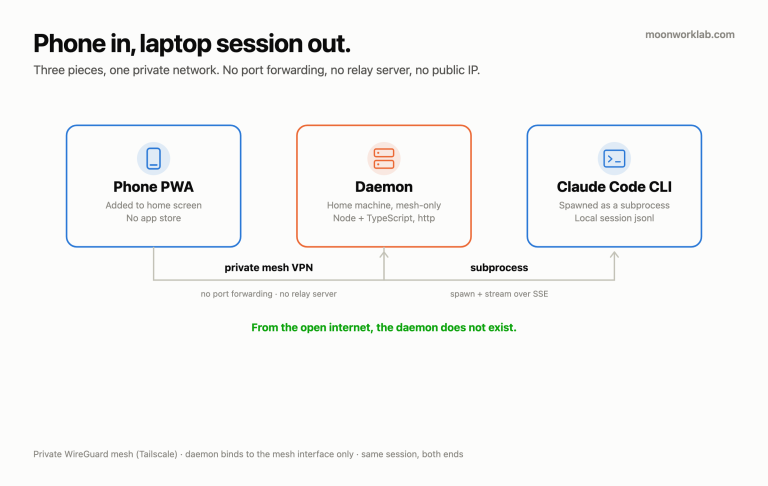
The tunnel’s four connections were reported at nearby Incheon locations. Their measured QUIC round trips were around 4–6 milliseconds. Meanwhile, public response metadata included SEA, and a separate trace response reported LAX.
Those observations don’t describe the same network segment. A healthy connection from the origin-side tunnel to Cloudflare doesn’t measure the full browser-to-application round trip.
Cloudflare documents the meaning and routing qualifications of its Cf-Ray header. I used the location information as a clue about request processing. I didn’t reconstruct the complete packet route from a three-letter suffix.
My working interpretation was that the public path contributed substantial delay. I didn’t establish which ISP decision or Cloudflare policy caused it. I also hadn’t confirmed the reporting person’s device, network, or browser, so I couldn’t claim their every symptom had the same cause.
Loading and playing weren’t the same measurement
A separate browser check reached Unity engine readiness in 952 milliseconds locally and 5,024 milliseconds publicly. Another check using a query-bearing address recorded 802 and 4,302 milliseconds respectively.
That’s two loading comparisons, not a distribution of gameplay responsiveness. Both support looking at the public path. Neither measures the time between pressing Enter and seeing an accepted answer during a complete match.
The major engine resources returned 200 in the first loading check. There was also a console 404 without an identified resource URL in the recorded error. I couldn’t honestly turn that unlocated message into “the engine failed to load” when readiness was observed.
I’d also encountered timeouts in an instrumented browser script. A separate check using ordinary browser settings reached readiness. Removing a forced graphics option didn’t eliminate every timeout in the instrumented script, either.
I kept those conflicting outcomes. I don’t know which remaining instrumentation or execution difference caused them. I didn’t publish the incomplete run as a measured frame-rate problem.
Don’t restart a shared service to test a guess
I didn’t change the game server, database, or tunnel settings during this diagnosis. Other public services used the shared tunnel, so a restart would have affected more than the page under investigation.
The useful next comparison was the same symptom through different access networks, with the reporting device identified. I needed to distinguish slow loading, delayed answer confirmation, and visual stutter. They can feel similar without sharing a cause.
A future result table should preserve those separate intervals. I’d include the endpoint, timestamp, sample count, browser conditions, and the actual action being timed. I wouldn’t replace missing gameplay measurements with the WebSocket median.
I’ve written about a genuinely unavailable blog origin separately. This was a different failure mode: successful requests with an expensive public round trip. The 200 response was the start of the investigation, not its conclusion.