My Local Model Wrote the Code for Free. Orchestrating It Cost $0.66 a Unit.
I built a loop that puts up a personal homepage on its own. It’s a static site, résumé-shaped, and I cut the work into units. Every unit spawns a fresh cloud agent. That agent plans, and it doesn’t write the code itself. It hands the code off to a local model on a remote machine. Then it runs the build and the linter, and commits when both pass.
I’d start it, go to sleep, and wake up to a site that had grown. I thought this shape had taken the bill off code generation.
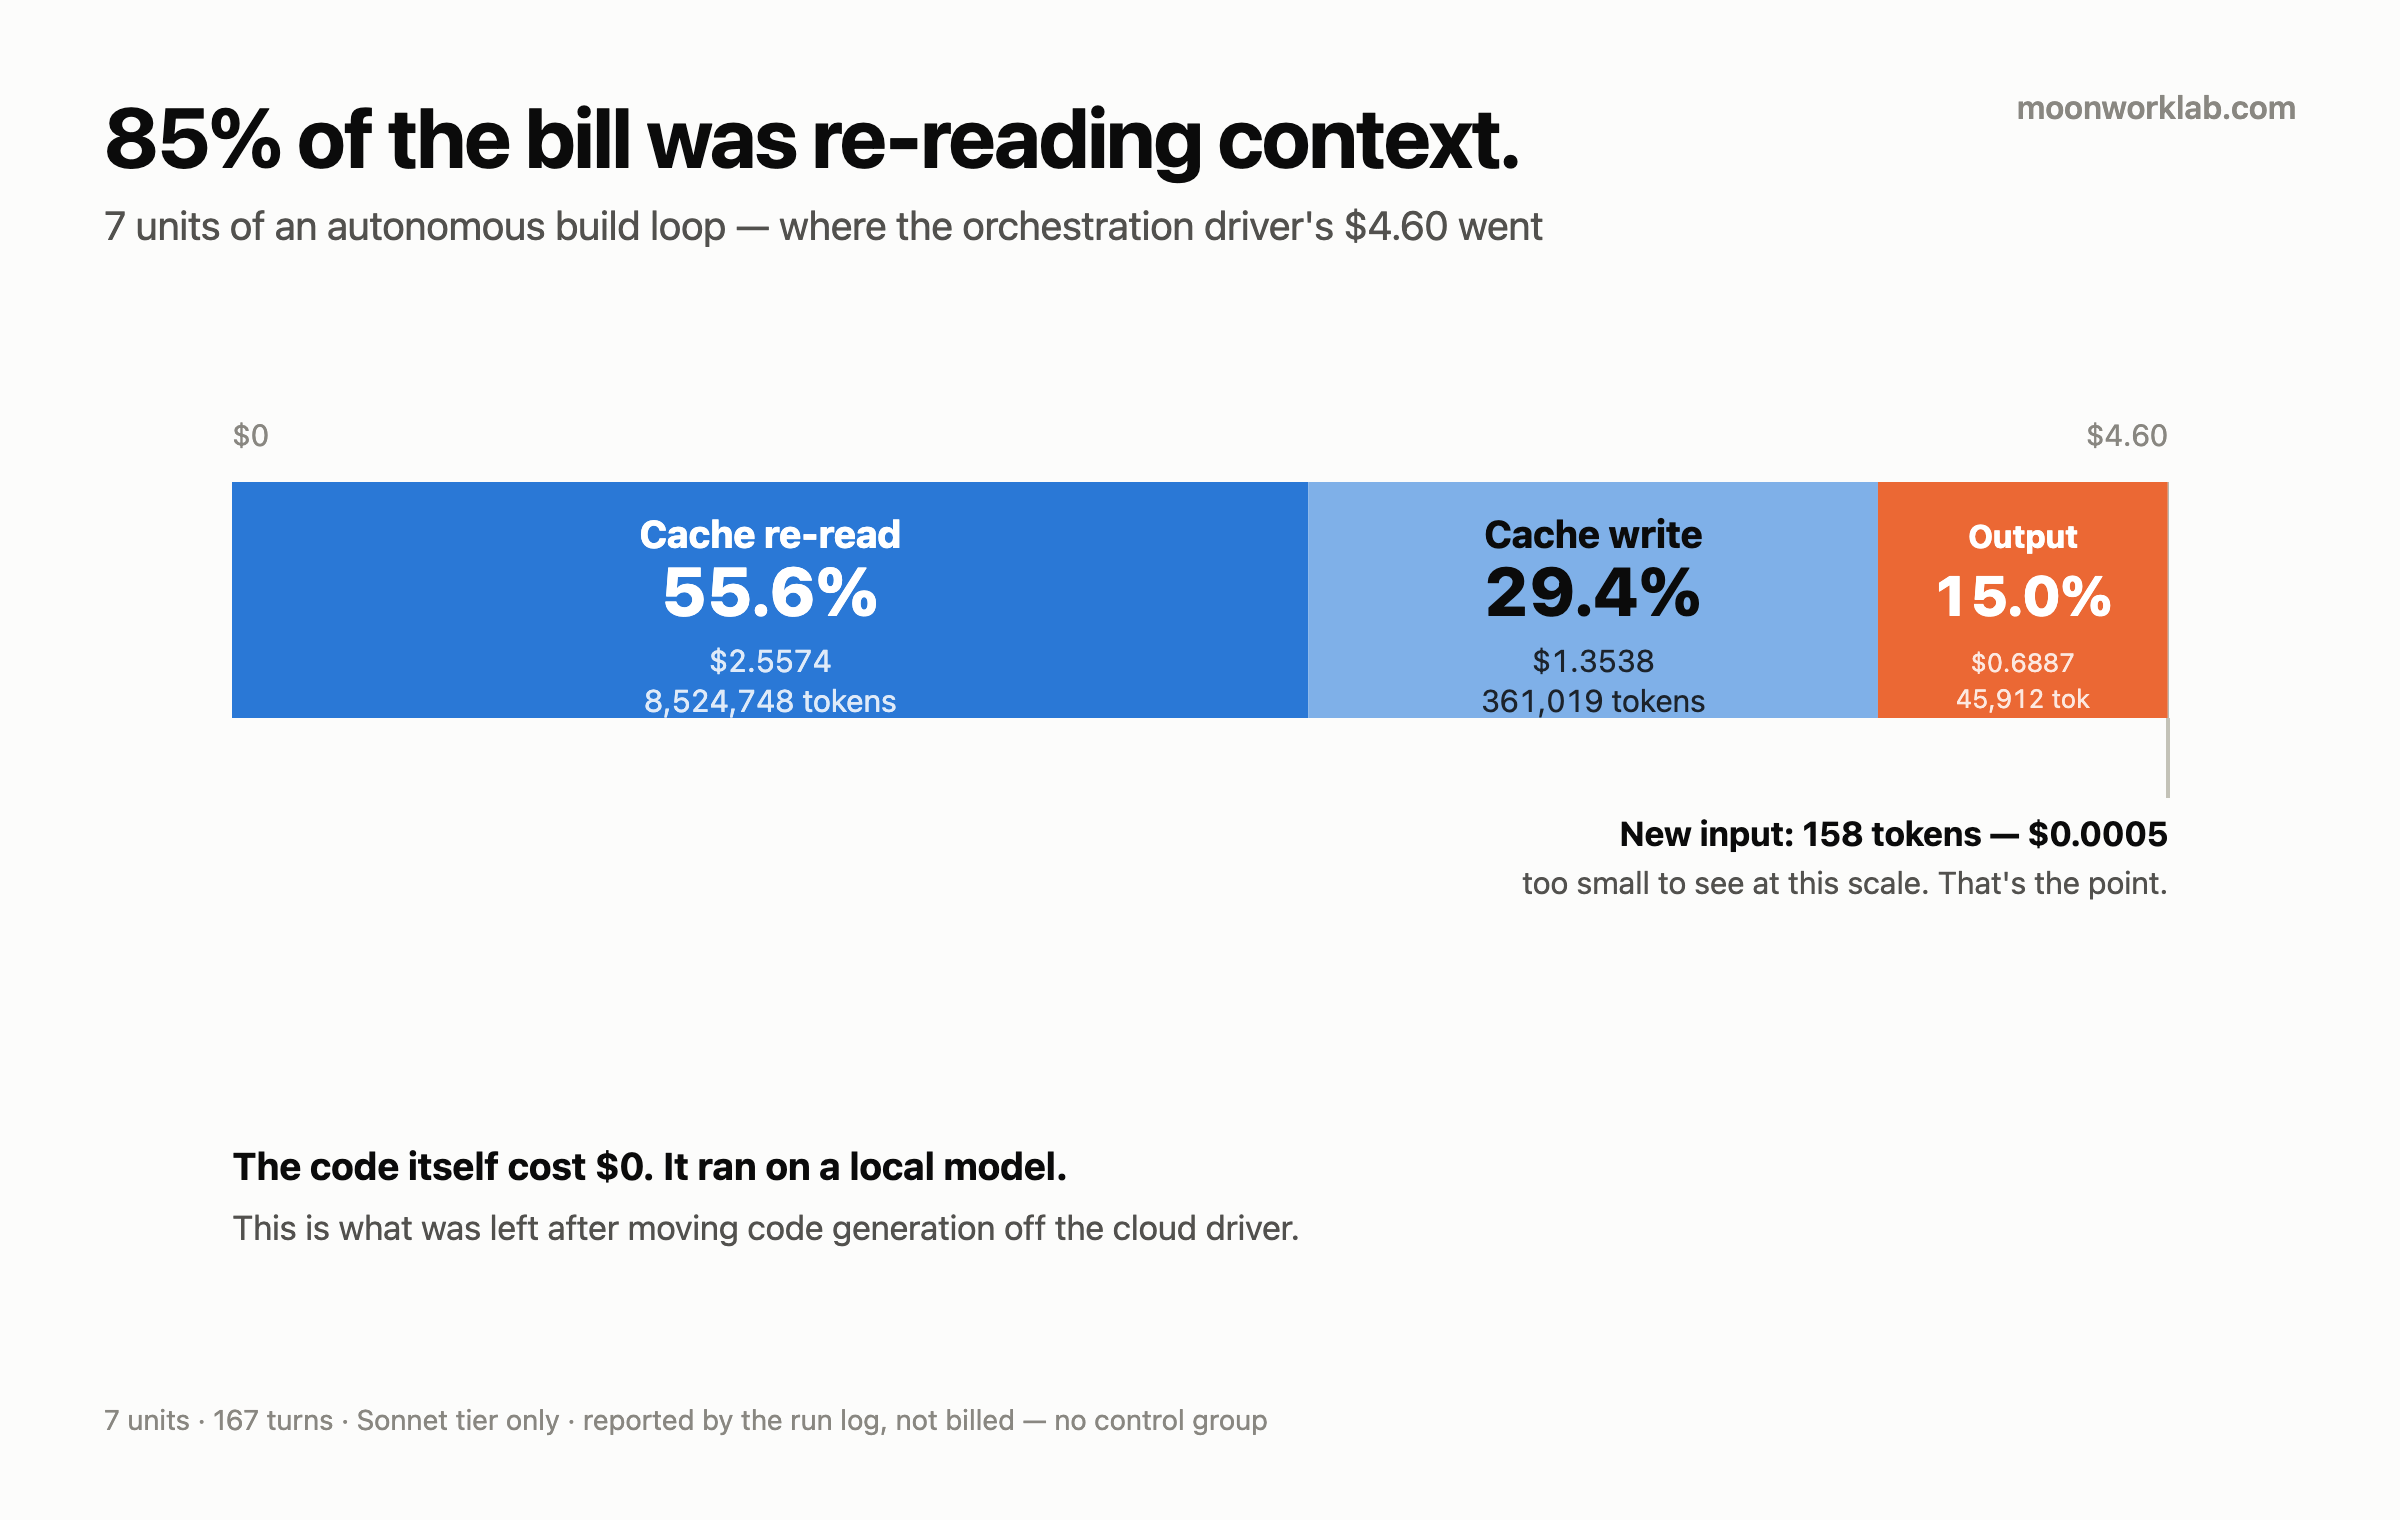
Then I opened the token logs for seven units. The fresh input tokens I sent came to 158 across all seven. Over the same seven runs, the tokens re-read out of cache came to 8,524,748.
This post is about those 8.5 million.
The setup — what ran, and where
Three pieces.
- The driver — a throwaway cloud agent that spawns fresh for each unit (Claude Code, Sonnet tier). It gets one prompt file, emits one result line, and dies. It doesn’t inherit a session.
- The code muscle — Qwen3-Coder-30B on a remote machine. The driver hands it “build this file / change it this way,” and it streams code back. I’ve already written up that machine and that card in the first post and the ninth. I won’t repeat it here.
- The harness — it runs units in order, stops after two consecutive failures, and writes tokens and cost to a table on every run.
The numbers here come from seven units that succeeded (U3–U10). Each run’s raw result file still holds the turn count, the elapsed time, and the per-model token usage.
Deployment isn’t in the loop. Pushing to the main branch deploys automatically, so the loop only ever works on a separate branch. Nothing goes live until a human looks at it and says yes.
Seven units, measured
| Unit | Turns | Driver output | Cache re-read | Cache write | New input | Qwen calls | Qwen output | Reported cost |
|---|---|---|---|---|---|---|---|---|
| U3 | 18 | 4,155 | 942,972 | 44,521 | 19 | 1 | 514 | $0.514 |
| U4 | 27 | 6,686 | 1,435,609 | 51,286 | 26 | 2 | 2,892 | $0.725 |
| U5 | 17 | 5,803 | 900,544 | 46,850 | 18 | 1 | 1,847 | $0.534 |
| U6 | 25 | 5,306 | 1,285,273 | 53,999 | 23 | 2 | 1,475 | $0.669 |
| U7 | 28 | 9,799 | 1,345,478 | 63,340 | 23 | 5 | 6,008 | $0.790 |
| U8 | 26 | 8,996 | 1,280,337 | 54,785 | 23 | 1 | 393 | $0.726 |
| U10 | 26 | 5,167 | 1,334,535 | 46,238 | 26 | 2 | 605 | $0.653 |
| Total | 167 | 45,912 | 8,524,748 | 361,019 | 158 | 14 | 13,734 | $4.611 |
Here are the measurement conditions. The tokens and the dollars aren’t something I measured — the run reported them about itself. Every unit’s result string ends in build+lint green, and that means the build and the linter passed. It doesn’t mean the code is good. I never measured code quality.
One line first. U8 is the unit that added two CSS variables. Qwen spent 393 output tokens on that job. In the same unit the driver emitted 8,996 tokens and re-read 1.28 million. It came to $0.726.
Across the seven units the average is $0.659, with a low of $0.514 (U3) and a high of $0.790 (U7).
I split the bill into line items
The run files already carry per-model cost. The Sonnet share is $4.60040, and the remaining $0.01017 belongs to a Haiku helper (9,646 input / 104 output tokens). Haiku is 0.22% of the whole. I won’t cover it further.
I took that $4.60040 back apart using the public rates. Input $3 / output $15 / cache write $3.75 / cache re-read $0.30, per million tokens. Multiplying the four line items and adding them gives $4.60039965. That matches what the log reported down to the decimal. I read that as the rate assumptions being right.
| Line item | Tokens | Amount | Share |
|---|---|---|---|
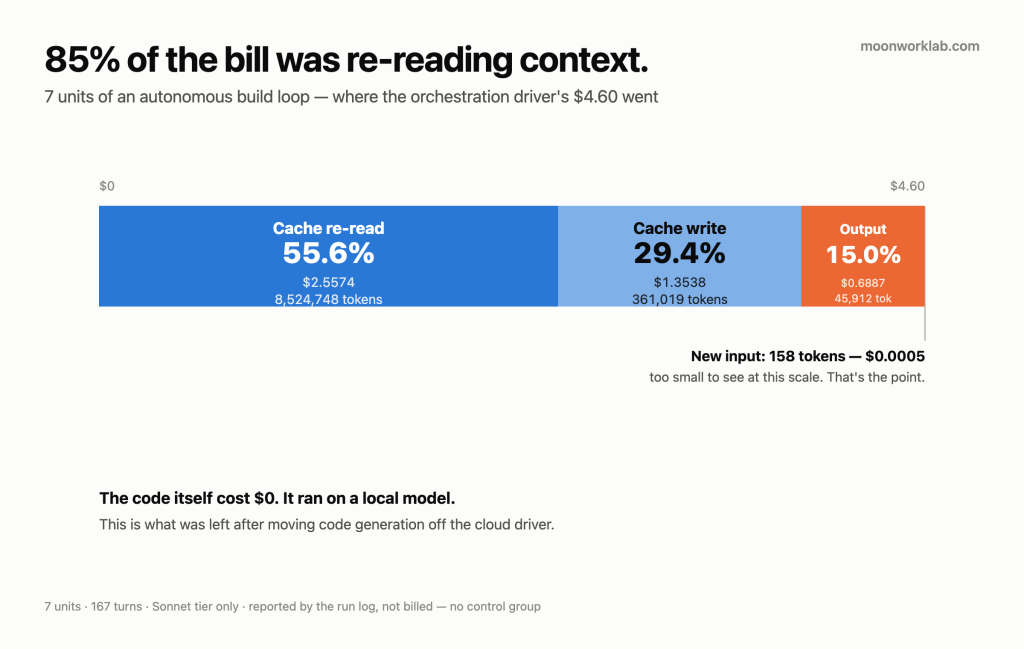
| Cache re-read | 8,524,748 | $2.5574 | 55.6% |
| Cache write | 361,019 | $1.3538 | 29.4% |
| Output | 45,912 | $0.6887 | 15.0% |
| New input | 158 | $0.0005 | 0.01% |
| Total (Sonnet) | 8,931,837 | $4.6004 | 100% |
Cache is 85.0%. Re-reading alone is 55.6%. The input I actually typed is 0.01%, and in money it doesn’t reach half a cent.
By token count it’s starker. 95.4% of everything the driver touched was context it had already seen.
Dividing by turns shows why. Seven units, 167 turns, an average of 51,046 cache-read tokens per turn. Every time the agent reaches for a tool, the whole context accumulated so far flows past again.
Observation and reading, split apart.
Observed: seven units, 167 turns, 8.5 million cache-read tokens, 55.6% of the cost.
My reading: re-reads grow superlinearly against turn count, because the whole cached prefix gets recomputed every turn. I never logged context size per request. I also never confirmed thatturnsequals the number of API requests. 51,046 is a division, not a measurement.
Cache is cheap. Reading 8.5 million of it isn’t
Cache re-read runs at a tenth of input. So I’d never once counted it as a line item. I’d filed it under “cache, so it’s the saving side,” and left it there.
A tenth of the rate still bills you when the count is 54,000 times higher. In this log the fresh input is 158 tokens and the cache re-read is 8,524,748. That’s a ratio of 53,954.
Here’s exactly what I’d missed. I had the instinct that cutting input tokens cuts the bill, so I put effort into keeping the driver prompt short. It is short. The result is 158 tokens, and it saved me half a cent. Over that same stretch I never once looked at how many turns the agent was taking. That side was $2.56.
What I moved was the cheap half
This is the heart of it, and it’s where I collide with something I’ve already published.
Over those same seven units, Qwen produced code in 14 calls, 13,734 output tokens. The driver’s own output over the same stretch was 45,912 tokens. That’s 3.34×.
| Local Qwen (code) | Cloud driver (orchestration) | |
|---|---|---|
| Calls / turns | 14 calls | 167 turns |
| Output tokens | 13,734 | 45,912 |
| Context tokens re-read | n/a (fresh request each time) | 8,524,748 |
| Reported cost | $0 | $4.611 |
| Actually billed | $0 | $0 (see below) |
In the ninth post I wrote that “the stage that burns the most tokens and the stage a local 30B handles well are the same cell. Move that one cell and the bill disappears.” In this workload it wasn’t. Code generation was the smaller side by output tokens, and moving it local didn’t remove a single cache-read token.
That sentence isn’t flatly wrong. What the ninth post had underneath it was an interactive session — a night when a cloud model wrote 1,900 lines itself and burned my whole five-hour limit in one sitting. There, the code was that model’s output. This post is an autonomous loop. I handed the code to somebody else, and what stayed behind was bigger.
So I’ll write the two sentences separately.
- Observed: in this loop code generation was 23% of output tokens, and after moving it local the remaining bill was $4.611.
- My reading: orchestration cost attaches to how many times the agent went around checking, not to the size of the job. U8 is the evidence — a unit worth 393 tokens of code took 26 turns and $0.726.
- What I never did: run those same units with the driver writing the code itself. So this post can’t tell you what the hybrid saved. There’s no control group.
The $4.611 was never billed
Time to be straight about it.
This driver ran inside my subscription. There’s no metered API key anywhere in it. So the additional money actually charged is $0. The dollars in these tables are what the run reported, converting to API list price.
Then why do the numbers mean anything. Two reasons.
- The limit is real. As I wrote in the ninth post, I’ve burned an entire five-hour limit in one night. A subscription bills you in capacity, not money. These 8.5 million tokens eat that capacity.
- The ratios don’t care who pays. Cache 55.6% / output 15.0% falls out of the rate card, and the structure is the same whoever’s paying.
I didn’t write down the subscription price in the ninth post, and I’m not writing it here. No estimate either. The blank I left then is still blank.
The local numbers — and why they don’t match what I published
The same harness records tok/s on every Qwen call. In this log the homepage stretch (2026-06-26 19:12 → 06-29 02:22) is 38 calls, and it holds later design cleanup work as well as the seven units above.
| Item | Measured |
|---|---|
| Calls | 38 |
| Generated tokens | 37,732 |
| Prompt tokens | 59,882 |
| Wall-clock generation time | 1,503.7 s (25 min 4 s) |
| Code produced | 108,604 characters |
| tok/s (output ≥ 500 tokens, 30 calls) | 18.9 – 31.8, median 26.1 |
| Lowest tok/s | 4.7 (64-token output, 13.5 s) |
| Cost | $0 |
One of these disagrees with a number I’ve already published. The ninth post lists this model at 41–50 tok/s. This table’s median is 26.1.
Both are mine, and they measure different things. The published line says 41–50 tok/s generation, and that word is the whole answer.
- 41–50 is the generation speed the inference server reports. It times the generation phase.
- 26.1 is wall-clock, measured by the harness: generated tokens ÷ the time from request start to finish. Connection, prompt processing and network all sit inside it.
Which of those ate how many seconds, I never split out. That the prompt tokens total 59,882 is the end of what I know.
The 4.7 tok/s floor isn’t a slow GPU. It was a request with a 64-token output. Most of those 13.5 seconds was fixed overhead, and the very next call came back at 31.8. Small jobs look worse in tok/s because the fixed cost stays in the denominator.
Which one is useful. If you’re estimating, it’s 26.1. Calculating with 41–50 won’t predict the time it actually takes. The number I published isn’t wrong — it measured something else.
Added 18 August 2026. That explanation was wrong. I went back and measured time-to-first-token directly: across ten runs it lands between 3.4% and 21.1% of the total, with a median near 5% — and the single 21% run was the first request after a restart. Nowhere near enough to explain a 13–15 tok/s gap at any cut. The real variable was VRAM contention — another process on the same card was holding a few gigabytes, and the local model’s own allocation shrank to make room. Free that VRAM and generation speed goes from the wall-clock median here straight back up into the 41–50 range I originally published, no code or flags changed. Connection and prompt processing were never the story; what was sharing the GPU was.
When throughput dropped — and why this section has no numbers
Running the loop, there were stretches where the inference server’s throughput fell over. I’d SSH into the remote machine and kill the inference server process. A watch loop on that side brought it back, the GPU re-initialised, and the harness carried on from the unit it was on.
That’s why there’s no table in this section.
What I wrote in my notes that day was “normally 41–50 t/s, force-kill when it drops to 10–13, recovers to 42 that way.” Not one of those log lines exists in either file. Of the 38 calls above, only two fall below 18.9, both with outputs under 500 tokens, and that isn’t this event — it’s the fixed overhead from the previous section.
- What survives is the procedure. Kill it and it recovers. I did that more than once.
- The numbers don’t reproduce. Neither 10–13 nor 42 can be pinned to a log. That’s why they’re not in this post’s tables.
- I still don’t know the cause. I never established why it dropped. I killed the process and moved to the next unit. Recovery isn’t diagnosis.
This is the same family as the threshold post, where a dramatic failure I remembered wouldn’t reproduce when I measured it again. I’m applying what I learned there, here.
Don’t do these — I did every one of them
- Don’t assume moving code generation local moves the token bill. I wrote that, and I published it. Measured, driver output was 3.34× code output, and cache re-reads didn’t drop by one token.
- Don’t file cache re-reads under “cheap, ignore.” A tenth of the rate is correct. At 53,954× the count, it’s 55.6% of the bill.
- Count turns before you spend time shortening prompts. I kept the driver prompt short. Seven runs of fresh input came to 158 tokens, saving half a cent. Over the same period I never counted a turn. That side was $2.56.
- Don’t assume a small unit is a cheap unit. Adding two CSS variables took 26 turns and $0.726. I cut my backlog by volume of code. That isn’t the predictor of cost.
- Don’t put the inference server’s reported generation speed into a harness estimate. I published 41–50, and the harness wall-clock median is 26.1. Both are mine, and they don’t go in the same slot.
- Don’t log agent runs as a total only. Splitting input, output and cache is what made this post possible. Not logging per-request context size is why section three stays a division.
- Don’t let a harness script resolve its own paths relatively. Mine computed its prompt and log paths relatively, then immediately moved into the repository directory. Run alone it worked; run through the loop the agent came up with an empty prompt. Log files landed in the wrong place too. I fixed it to resolve absolute paths before moving. What those failed runs burned isn’t in my logs — what’s left is the seven that succeeded.
- Don’t hand the loop a branch that auto-deploys. This one I didn’t do. I cut it onto a separate branch from the start, and I’d make that call again.
Honest limits — what this post can’t do
- There’s no control group. I never ran the same units with the driver alone. I can’t state a reduction.
- The sample is seven. No repeats, no variance, and the units differ in character.
- I never logged context size per request. The 51,046 per turn is a division. I also never confirmed
turnsequals API requests. - I never measured code quality.
build+lint greenis all there is. How much a human fixed afterwards isn’t in this post. That design cleanup came later at all is a hint, and I left no number on it. - I never timed the human gate. There’s no record of the minutes I spent approving and reviewing. So this post doesn’t say anything is cheap. It says where the money went, line by line.
- The amount actually billed is $0. The dollars here are the tool’s conversion at API list price.
- The throughput-drop event has no numbers. That section says so.
- I never decomposed the local tok/s. Whether the gap between 26.1 and 41–50 is prompt processing, network or connection cost, I never split out.
- I don’t know how these ratios look on another model or tier. I never ran it. A different rate card moves 55.6%. I read the structure — cache attaching to context reuse — as the same. I never confirmed that.
- My notes and my logs disagreed in one place. A memory from 51 days ago says “$2.44 / 4 driver runs.” Adding the first four rows of the current log gives exactly $2.4421 — the memory wasn’t wrong, it was a snapshot at four runs. The same way, “about 6.7k tokens for all of M1” matches the 26 June batch’s Qwen output total of 6,728. This time the memory held. As I wrote in the memory-system post, old memories spoil — and whether one has spoiled is something you only learn by holding it against a log.
Closing
The rule I wrote for myself was “code generation goes local.” That rule still holds. What it moved, though, was the smaller half.
On the bill for seven units the code came to $0, and the context sent back and forth to order that code came to $4.611. Of that, $2.56 was the price of reading something I’d already read.
What I’m counting next isn’t prompt length. It’s turns.