WAN 2.2 Sampled for 28 Minutes, Then Died at VAE Decode — 48 Channels vs 16
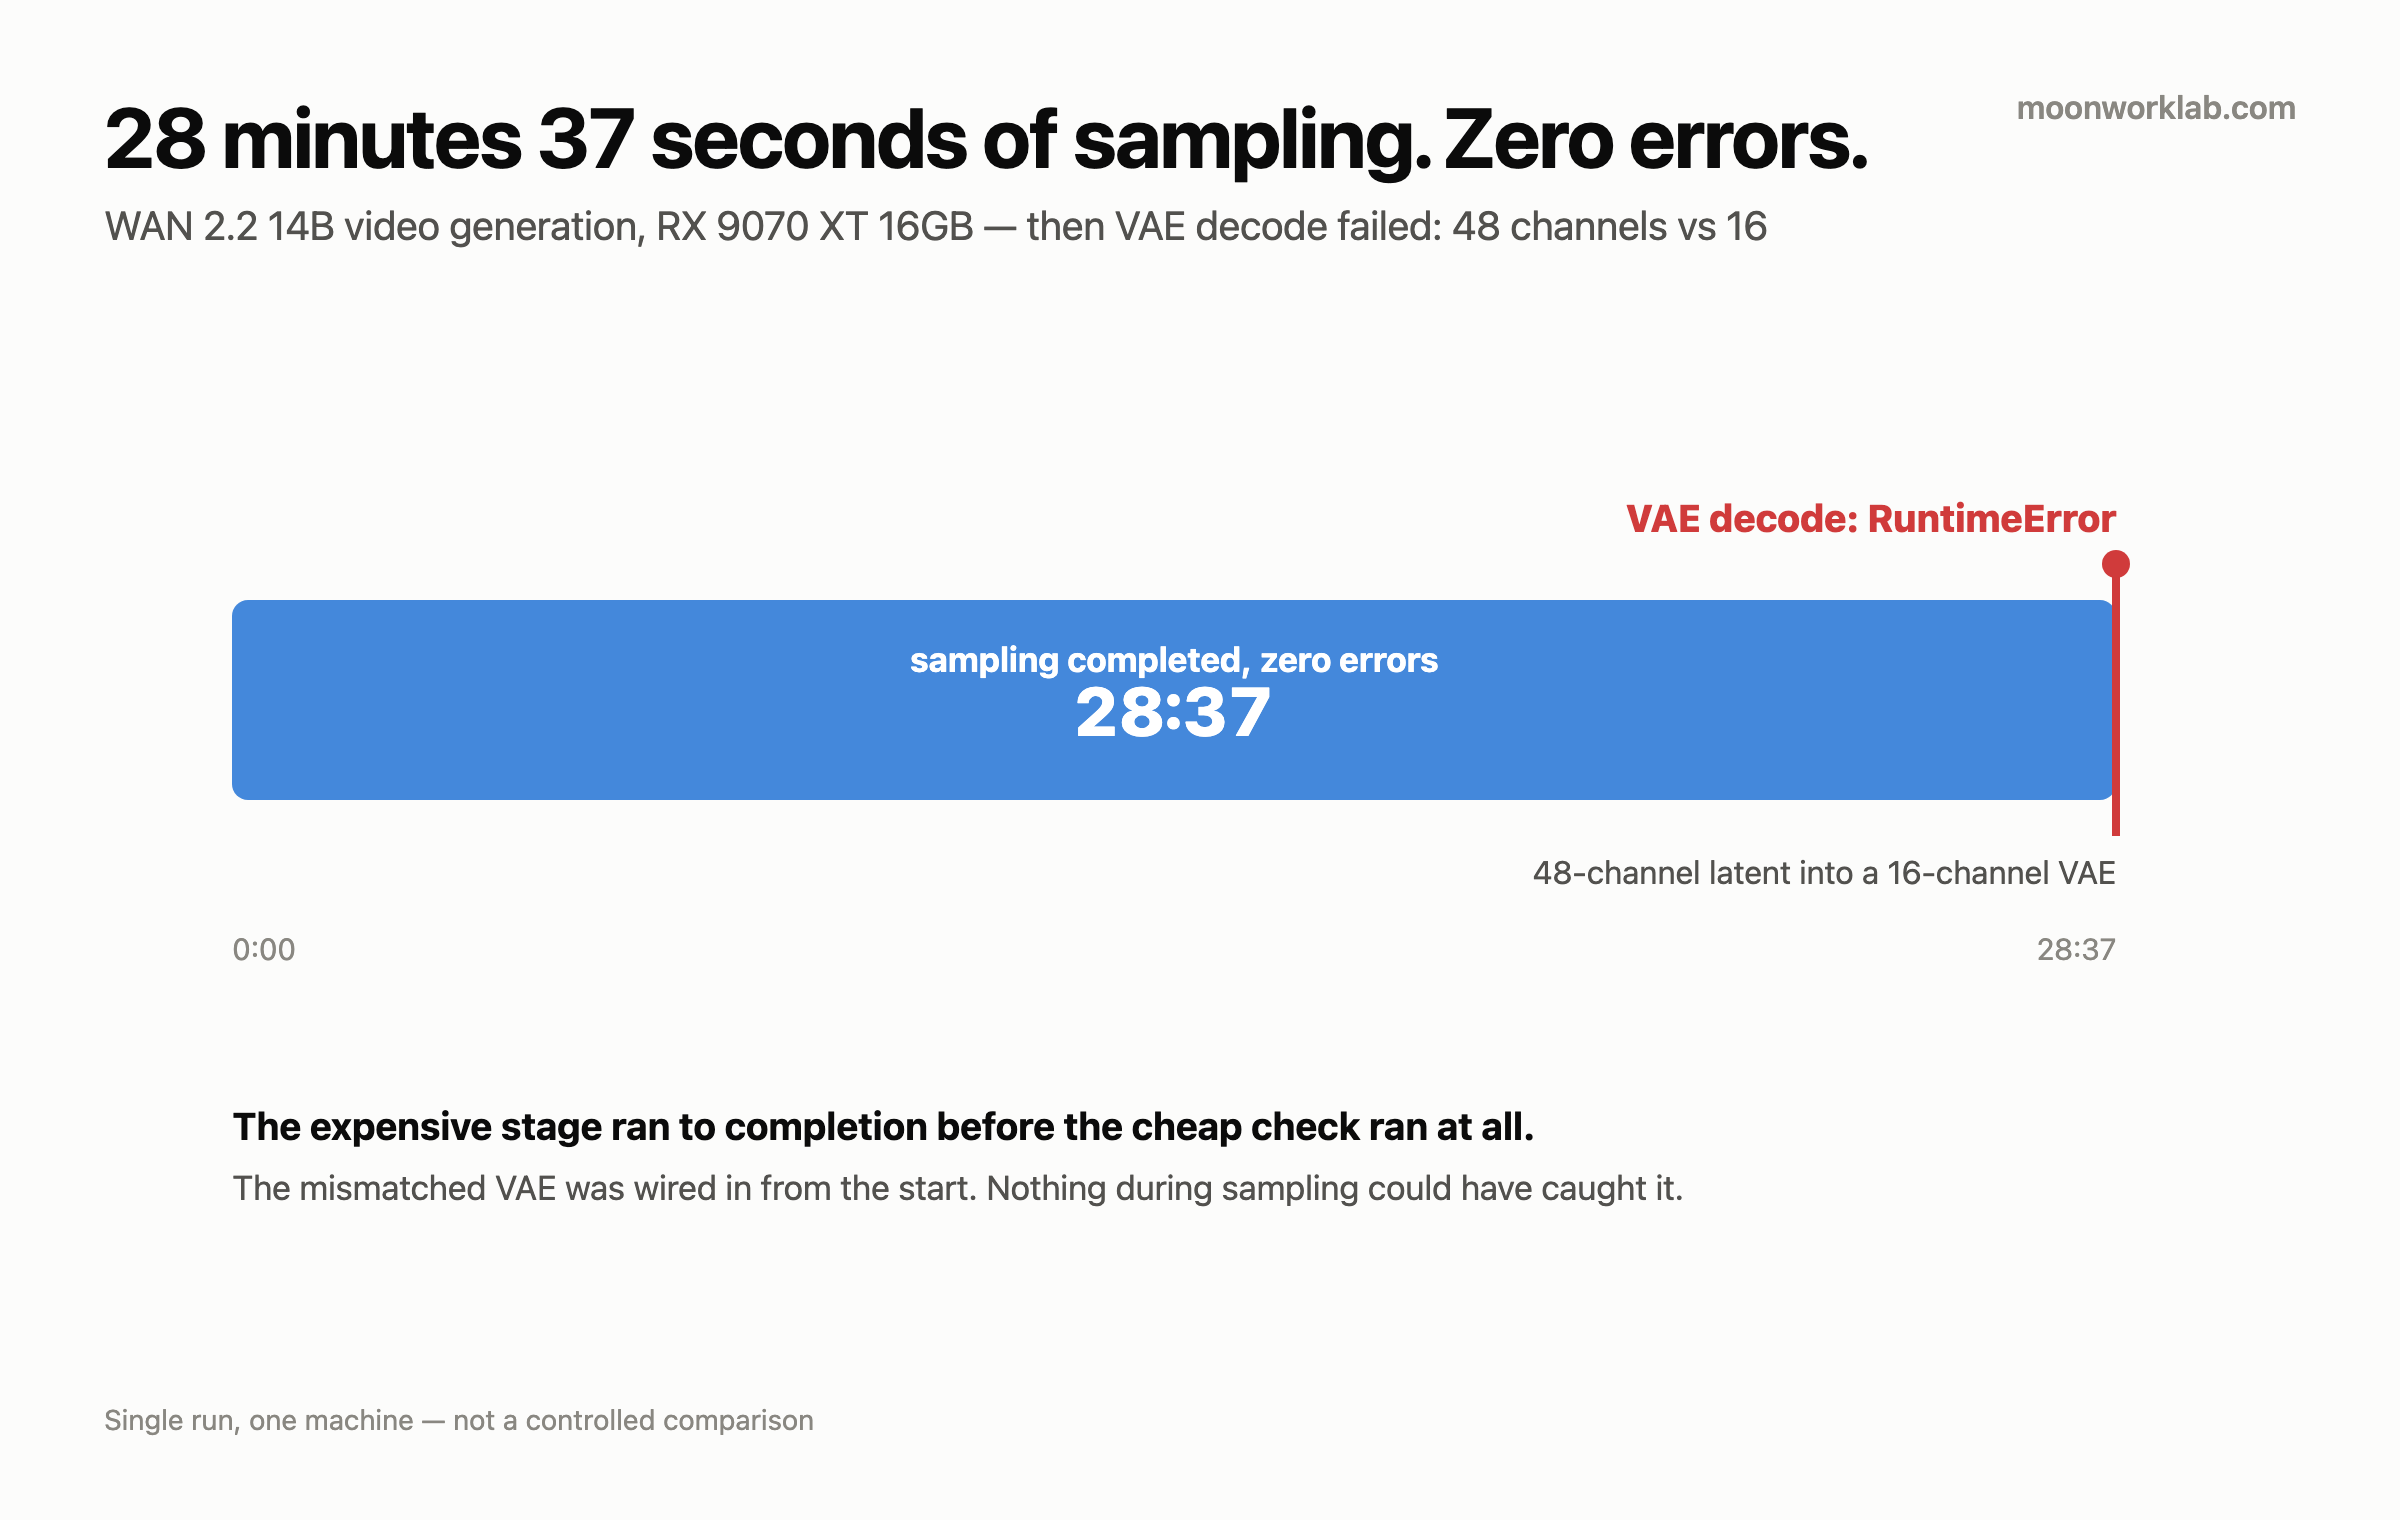
My GPU worked for 28 minutes and 37 seconds without a single complaint. Every step ran, and sampling finished. Then the last node in the graph printed this.
RuntimeError: expected input to have 48 channels, but got 16Decoding never started. Everything those 28 minutes and 37 seconds produced went straight in the bin.
The cause wasn’t the GPU, the driver or the model. Node 4 of my workflow file had a VAE for a different model plugged into it. Fixing that means changing one file, and the information behind that call comes from comparing two integers. That comparison sat 28 minutes downstream of the work.
This post is about those 28 minutes. A second run turns up further down, and it isn’t a control for the first one.
The setup — what I ran, and where
One machine: the main PC I use for local generation. The GPU is an RX 9070 XT 16GB (PyTorch reports it as 15.9GB), on Windows, running ComfyUI against a ROCm nightly build of PyTorch for the gfx120X family. The day before, I’d confirmed torch.cuda.is_available()=True and device detection. On that same setup an SD 1.5 image at 512² and 20 steps came out in about 5 seconds.
One thing here contradicts something already published on this site, so I’ll get it out first. In the first post I skipped ROCm entirely for my coding LLM and went with Vulkan, because RDNA4 support wasn’t mature. The ComfyUI side of this machine runs on ROCm PyTorch. Same card, different stack. Avoiding one of them didn’t mean I avoided the other.
The model was WAN 2.2 T2V 14B. That machine also had the 5B (TI2V) weights of the same family sitting on it, and both VAE files were present too. That’s the premise of the whole incident — there were two VAEs to pick from, and node 4 was holding the wrong one.
The resolution, frame count and step count of that first run aren’t in my records. What I wrote down that day stops at “14B T2V, sampling completed at 28:37.”
The error came from tensor shape, not from the GPU
Here’s the line again, exactly as it printed.
RuntimeError: expected input to have 48 channels, but got 16This isn’t an out-of-memory failure, a kernel failure or a driver problem. It says two tensor shapes disagree. The receiving side expected 48 channels, and what arrived had 16.
The side that arrived, with 16 channels, is the latent the 14B sampler produced. The side that expected 48 is the VAE plugged into node 4. So the model emitted exactly what the 14B spec calls for, and the decoder waiting to receive it was built to a different one.
This belongs to the same family as the trap I hit in my fifth post. That time a single threshold quietly wiped out every result. This one is the reverse — it died loudly, and the place it died wasn’t the place the fault lived. The error came out of the VAE node. The fault was in what my workflow file had wired into that node.
WAN 2.2’s 5B and 14B don’t share a VAE
This is the core of the post.
- WAN 2.2 TI2V-5B uses a new VAE, with 48-channel latents.
- WAN 2.2 T2V/I2V 14B keeps the WAN 2.1-family VAE, with 16-channel latents.
Same 2.2, and a different latent space. So the two don’t swap for each other. The name wan2.2_vae points at the model family, and it doesn’t point at which parameter count it was built for. Not telling those two apart is on me.
That’s exactly where I got caught. I never even got as far as thinking “2.2 model, so 2.2 VAE.” I didn’t think about it at all. Something was already plugged into the workflow file, I changed the model and the prompt, and I hit run.
Observation and interpretation, written down separately.
Observed: node 4 held
wan2.2_vae(48 channels), and the error above landed after 14B sampling. Swapping in the 16-channel VAE made the same 14B produce output normally.My read: these two variants carry different latent channel counts, so they’re incompatible at the VAE level. I only broke the 14B into 48-channel VAE direction for real. The other direction, a 5B with a 16-channel VAE, I never tried.
Why a 48-channel VAE was sitting in that workflow file, and where the file came from, isn’t recorded anywhere. Running the 5B first and leaving the VAE behind would explain it. There’s no record of me running the 5B that day, so I’m writing this one down as something I don’t know.
The fix — one node
I changed node 4’s VAE to the 16-channel WAN 2.1 VAE. That one slot is the whole of what I changed. Both VAE files were already on the machine, so there was no download either.
How long the fix took isn’t recorded. One line on the bill is certain — 28 minutes and 37 seconds of GPU time. Those 28 minutes never came back.
The second run, and why it isn’t a control
That night I ran it again with the corrected workflow. 480² at 25 frames and 12 steps, about 11 minutes, and it produced output normally.
This is where I have to stop, because it’s the spot where subtracting the two numbers starts to look tempting.
| First run (2026-07-05) | Second run (same night) | |
|---|---|---|
| Result | Failed at VAE decode | Normal output |
| Sampling time | 28:37 (completed) | I never timed it separately |
| Total time | Unmeasurable — it never reached the end | About 11 minutes, through to output |
| Resolution / frames / steps | Not recorded | 480² / 25 frames / 12 steps |
| Node 4 VAE | wan2.2_vae (48 channels) |
WAN 2.1 VAE (16 channels) |
| Coding LLM on the same GPU | Running | None |
At least three things moved between those two runs. The VAE, the generation parameters, and whether a coding LLM was competing for the same card. Coding and generation share one card on that machine, and I’ve already written up what that costs me. The note I left that day put the speed difference down to “no GPU contention with the coding LLM.” My own note had already picked one variable out of three. How much of the time that contention actually ate, I never measured.
- 28:37 is solid. It’s real time that elapsed before the failure, and it’s a number sitting in a log. The 11 minutes is a real number too. It’s a second data point, taken at different settings under different GPU conditions.
- The two of them aren’t a before and after. Subtracting two runs where three variables moved together, then handing the difference to one of them, is storytelling rather than measurement.
What the VAE swap did to the time, I don’t know. Finding out takes two runs at the same resolution, frames and steps, with the coding LLM shut down, changing only the VAE. I didn’t do that. The video came out, and I went on to the next thing.
Don’t do these — every one of them mine
- Don’t hit run without looking at what’s plugged into the workflow file. I changed the model and the prompt. Node 4 never got a glance from me, and that cost me 28 minutes.
- Don’t treat a version number in a filename as evidence of compatibility.
wan2.2_vaegenuinely is for WAN 2.2. It’s for the 5B of 2.2. A name being right doesn’t make the spec right. - Don’t jump to full spec on the first run of a long job. I went straight to full spec without one short low-step rehearsal in front of it. My read: a channel-count check looks at the shape of the latent tensor and never at the step count, so a short run would have shown me the same error far more cheaply. I never ran that short version to confirm it.
- Don’t read “sampling completed” as “the pipeline is healthy.” The most expensive stage passing means that stage passed, and nothing else.
- Don’t change several settings at once and rerun after a failure. I changed the VAE and the generation parameters together. That’s why this post holds no two comparable numbers.
- Don’t skip the record because nothing errored. Not writing down the first run’s resolution, frames and steps is the part that hurts most now. The runs that fail are the ones whose settings most need keeping.
Honest limits — what this post can’t do
- There’s no controlled A/B here. Three variables moved together, and I never separated them out.
- Two data points, and that’s all. One failure, one success. No repeat runs, and no deviation figures.
- I don’t know the first run’s resolution, frames or steps. So this post can’t tell you what workload 28:37 is the time for. 28:37 is “the time that run spent before it failed,” and it isn’t a performance figure.
- I don’t know how long VAE decode itself takes. The first run never began decoding, and I never split decode out of the second run’s 11 minutes. When this post calls the decode check cheap, the basis is the nature of the check rather than a measured time — comparing channel counts is comparing two integers.
- I never broke the opposite direction. What a 5B does when a 16-channel VAE gets attached to it, I never tried. My read is that it’s symmetric. I haven’t checked.
- One combination: AMD, ROCm, Windows. Whether the same channel mismatch prints the same words on CUDA, or gets caught earlier by a different front end, I don’t know. Shape checks don’t care about the vendor, so I read this as CUDA hitting the same message. I never ran it.
- I never looked for a way to have ComfyUI catch this before the run starts. Whether a node or an extension validates the graph up front, I don’t know. I fixed my file and went straight to the next thing.
- I don’t know where the workflow file came from. Exactly as written further up.
Closing
What I actually learned here isn’t the channel count of WAN’s VAEs. When the cheapest check runs last, that check’s value becomes every stage standing in front of it.
This time, that number was 28 minutes and 37 seconds.