I gave away 2GB of VRAM and nothing happened. At the next 70MB, 30% was gone.
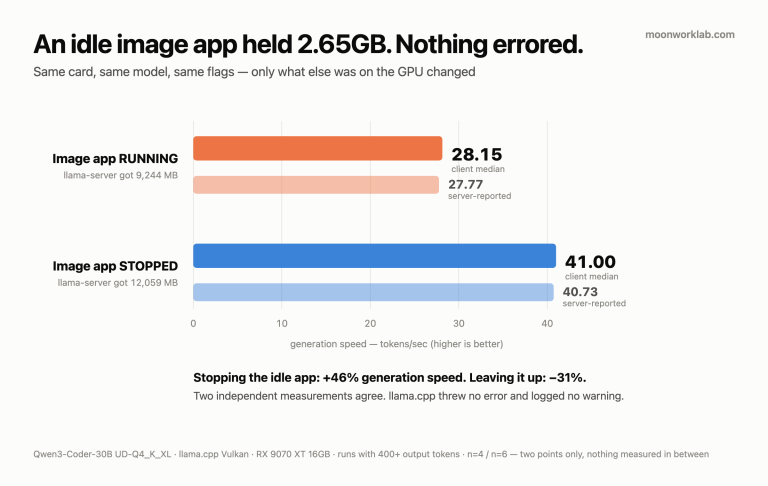
A month ago I published a post on this site about the same card. An image generation app was doing nothing at all and holding 2.65GB of VRAM, and my local coding model generated at 28.2 tok/s instead of 41.0. Not one error was thrown.
That post had two points on it. So I never knew the shape of the graph. A gentle slope, where a little more taken costs a little more speed? Or a step, fine up to a line and broken past it? I wrote that down in that post’s limits and left it as the first follow-up.
This time I turned the occupancy like a dial and measured again. Here’s what came out.
I gave the occupier one GPU layer (adapter VRAM +2.06GB): no change in speed. 42.6 → 41.95 tok/s. That’s noise.
I gave it one more layer (adapter VRAM +2.13GB): 41.95 → 29.9 tok/s.
The VRAM difference between those two conditions is 0.07GB. 70MB. Handing over a full 2GB did nothing at all. At the next 70MB, 29% was gone.
It’s a step, not a slope. And I don’t know why the step sits where it does. The VRAM numbers I took don’t explain it. This post is written with that hole left open.
The question the last post left open
The limits section of the 18 August post carries this line.
I never measured the middle. Whether free VRAM and speed relate linearly or in steps, I don’t know. I have two points.
That line matters, since a practical question hangs off it. How much headroom do I have to leave? On a slope the answer is easy — whatever I keep buys me something, and I can settle anywhere in the middle. A step is a different question. Above the line it’s free, one notch over and it’s gone. There’s no middle to negotiate with.
So this round I went to put a point in the middle.
I swapped the occupier for something with a dial on it
In the August measurement the thing holding VRAM was a real image generation app. I don’t get to set how much it takes. It grabs what it wants, and my two options are running and stopped.
So I changed the occupier. I started a separate model with nothing to do with coding (gpt-oss-20b-MXFP4.gguf) as a second llama-server on another port, and moved the occupancy with -ngl alone — the number of layers it puts on the GPU. That server never took a single inference request. Zero of them. It sat there.
The image app in the August post was idle too, queue empty. This is the same arrangement with a dial bolted on.
What I measured
| Item | Value |
|---|---|
| Hardware | AMD Radeon RX 9070 XT (16GB) · Windows 11 |
| Subject | the coding llama-server, Vulkan, Qwen3-Coder-30B-A3B-Instruct-UD-Q4_K_XL.gguf |
| Subject flags | -ngl 99 --n-cpu-moe 14 -c 16384 --parallel 1 --jinja --no-mmap, port 8080 |
| Occupier | a second llama-server, same card, gpt-oss-20b-MXFP4.gguf, port 8081, 0 requests |
| Variable | the occupier’s -ngl — 0 (none) / 1 / 2. That one thing and nothing else |
| Bench tool | the --dry-run path of my existing coding offload harness. No files get written |
| Prompts | two fixed ones — spec A (903–1,052 completion tokens) / spec B (1,163–1,652 completion tokens) |
| Repeats | 4 per spec per condition. Spec A in tier 1 is the exception at 3 (below) |
| VRAM reading | Windows performance counter \GPU Adapter Memory(*)\Dedicated Usage — the adapter-wide value |
The counter choice is what the last benchmark taught me. The per-process counter (\GPU Process Memory(*)) once reported 32GB for one process on a 16GB card, so I dropped that whole family. This round I went with the adapter-wide value and deltas from the start.
Results
Every figure is a gen tok/s median. Brackets hold that condition’s full range and n.
| Condition | Occupier -ngl |
Adapter VRAM | vs baseline | Spec A | Spec B |
|---|---|---|---|---|---|
| tier 0 | none | 14.64 GB | — | 42.6 (42.4–42.8, n=4) | 41.25 (40.8–41.5, n=4) |
| tier 0b | 1 | 16.70 GB | +2.06 GB | 41.95 (41.8–42.1, n=4) | 41.85 (41.8–42.0, n=4) |
| tier 1 | 2 | 16.77 GB | +2.13 GB | 29.9 (29.9–30.0, n=3) | 29.6 (29.5–29.6, n=4) |
tier 0 → tier 0b. The occupier took over 2GB of VRAM it hadn’t held before and the speed stayed put. Spec A went from 42.6 to 41.95, down 0.65. Spec B went from 41.25 to 41.85, which is up. Two directions out of one change is what noise looks like, not a signal.
tier 0b → tier 1. Adapter VRAM went from +2.06GB to +2.13GB. A 0.07GB difference. Speed went 41.95 → 29.9 and 41.85 → 29.6.
I state the direction whenever I use a percentage. I got a direction wrong out loud once in the August post, and I’ve written them this way since.
- The losing direction: −28.7% (spec A) / −29.3% (spec B).
- The recovering direction: +40.3% (spec A) / +41.4% (spec B).
Those are two ways of stating one gap, not two measurements. 41.95 down to 29.9 is −28.7%; 29.9 back up to 41.95 is +40.3%.
Spread inside a condition never reaches 1 tok/s. Spec B in tier 1 runs 29.5–29.6, a width of 0.1. Nothing here is one stray value.
The raw numbers
tier 0  (no occupier)     spec A: 42.7, 42.4, 42.8, 42.5
                          spec B: 41.5, 41.1, 40.8, 41.4
tier 0b (occupier -ngl 1) spec A: 41.8, 41.9, 42.1, 42.0
                          spec B: 42.0, 41.9, 41.8, 41.8
tier 1  (occupier -ngl 2) spec A: 29.9, 30.0, 29.9          (n=3)
                          spec B: 29.6, 29.6, 29.5, 29.6
What it actually took
This measurement didn’t finish in one sitting. The first timestamp in the raw logs is 09-09 15:19 and the last is 09-10 13:45. A bench run takes under five minutes per condition, and this took more than a day.
1. My first attempt at handing it to a background process broke three times running.
Two causes, both mine. One was starting the occupier bound locally and then trying to check on it from a different machine — the occupier is a thing that answers no requests, so the binding never mattered. The server was fine and my way of checking was wrong. The other was background processes dying for no reason I could name once a turn ended and time passed. That one I still can’t explain.
I gave up on delegating it and finished the whole thing sitting in one chair, running the conditions by hand, one after another. Three failed attempts at automating it, then I did it by hand.
2. The coding server shuts itself down after 20 idle minutes. That’s deliberate, and it’s there to give the VRAM back. It caught me twice mid-measurement. I restarted it, sent one warm-up request, then read the VRAM — and found something I wasn’t looking for.
Straight after start-up the adapter VRAM read 4.17GB. One real request later it jumped to the 14–15GB range.
The big allocation lands at first actual use, not when the server comes up. Had I read the baseline right after starting the server, tier 0 would be recorded here as 4.17GB and every table in this post would be garbage. Every value above is a post-warm-up value.
3. Spec A in tier 1 stopped at three runs. It overlapped with a session dropping out. After I picked it back up, spec B filled out its four normally. Those three runs span 29.9–30.0, a width of 0.1, and my read is that the conclusion doesn’t move. I still planned four and got three, and I’m not going to write it up as four.
I don’t know why the cliff is there
This is the most important section in the post.
Writing that 70MB produced 30% would be a causal claim. I have nothing to back that. I observed exactly two things.
- Moving the occupier’s
-nglfrom 1 to 2 takes generation speed down 29%. - Across that same transition, the adapter VRAM counter moved 70MB.
I never built a bridge between those two. So the cliff sits at some other boundary between -ngl 1 and -ngl 2, not at “how much more VRAM got held”. What that boundary is, the numbers I took this round don’t say.
A few candidates came to mind. Memory fragmentation, a threshold where some buffer moves out to shared system memory, scheduling between two GPU processes. Every one of those is a guess. I confirmed none of them. I never looked inside the machine, and I’m not looking inside it in this post. I stop here.
This is a variation on a shape that keeps coming back on this site. In the compressed cache post the logs were clean and the result was bad. In the monitor post I read the same value five times and that value wasn’t real. This time the numbers reproduce and they don’t explain the result. All three finish in the same place — the observation is solid and there’s no explanation attached.
What I didn’t measure
- The occupier isn’t the app from the original incident.
gpt-oss-20bis not an image generation app. Holding VRAM is the only thing they share. Whether a real image app grabs memory in the same pattern, I don’t know. - The occupier never computed anything. Zero requests. This post measured an idle neighbour taking up space, not two workloads actually fighting over GPU compute. That’s a different experiment.
-ngland real VRAM consumption aren’t proportional. One extra layer costing 70MB is the evidence for that. My guess is that fixed overhead like embeddings and the output layer is booked large and separately from the layer count. That’s a guess and not a measurement. I never checked it.- The adapter counter reported 16.70–16.77GB on a 16GB card. Whether that’s counter error, or the adapter counter also counting whatever went out to shared system memory, I don’t know. I’m flagging it as a physically strange value and leaving it in. What this post uses is the delta between conditions, not the absolute number.
- I only looked at two notches of occupancy.
-ngl1 and 2. What 3, 4 or 8 do, I never measured. Seeing close to 30% gone at 2, I stopped there for the day. - I measured it across two sessions. By log timestamp, tier 0 and tier 1’s spec A ran on 09-09; tier 0b and tier 1’s spec B ran on 09-10. I left the flags and the model files alone and carried on from where I stopped, but what happened to that machine in between isn’t in the logs. I’m not claiming this equals one continuous sitting.
- n is small. Three or four per condition. That spread inside each condition stays under 1 tok/s is everything I’ve got.
- One card, one driver, one backend, one pair of models. Vulkan, this llama.cpp build, these two GGUFs. Whether the cliff sits in the same place on any other combination, I don’t know.
Don’t line these numbers up against the August post’s
The two points in the August post were these. With llama-server allocated 9,244MB, 28.15 tok/s; with 12,059MB, 41.00 tok/s. This round’s tier 0 is 41.25–42.6 tok/s.
At “almost nothing else on the card” the direction agrees. August’s fast side at 41.00 and this round’s tier 0 sit in the same place. That’s as far as it goes.
The VRAM absolutes from the two posts don’t compare 1:1. The occupier model is different, and I moved the counter from per-process to adapter-wide. They aren’t two axes measuring the same thing. What carries over from the August post is the direction and the fact that a cliff exists. The numbers don’t carry over.
Don’t do these
- Don’t read this as “70MB of VRAM makes it 30% slower”. That causation isn’t in this post. What I saw is two values moving together across one transition, and I couldn’t build a single line of evidence that one of them produced the other.
- Don’t pull a “leave N GB of headroom” rule out of this. If I knew that number I’d have put it in the title. What this measurement hands over is one warning, not a rule.
- Don’t assume
-ngl 2is the boundary on another card. That boundary is where it showed up on this card, this driver, this backend, this pair of models. A layer is a different quantity in every model. - Don’t relax because the occupier is idle. That server took zero inference requests. It never did a minute of work and the server next to it lost 30%.
- Don’t read VRAM the moment a server starts and then use that value. I nearly did. Cold it’s 4.17GB, one request later it’s 14–15GB. Had 4.17 gone into the setup table, this entire post would have shipped wrong.
- Don’t subtract the August post’s MB figures from this post’s GB figures. Exactly as written above. Different axes.
Closing
The original question was how much headroom to leave. I didn’t come back with a precise answer. Here’s what I did come back with.
A very small amount taken is enough to be dangerous. And how much got taken doesn’t tell me whether I’m in danger.
With 2GB handed over, the table said nothing happened. In the same table, 29% disappeared after 70MB. The habit of keeping a VRAM readout on screen and judging “still got room” from it ended with this measurement. That number doesn’t tell me which side of the threshold I’m standing on.
The next measurement is already decided. Push -ngl to 3, 4 and 8 to see whether the ground below the cliff is flat or keeps falling, and open up the machine to find what actually changes between 1 and 2. The second one I didn’t do today.
Update: I ran that measurement. It didn’t finish — a completely unrelated infrastructure incident interrupted it partway through, and the data that came out the other side wasn’t clean enough to trust. The cliff’s cause is still open.
Money spent: zero. The card was already in that machine, and both model files and the inference server are free. This site pays for no APIs. The bench itself was five minutes per condition, and first run to last run took a day. The whole difference went into watching automation break three times.