An Idle Image App Held 2.65GB of VRAM. Closing It Made My Local Model 46% Faster.
I run a local coding model and an image generation app on the same card. The image app was doing nothing at the time. Its queue was empty and nothing was being drawn.
It was holding 2,651MB of VRAM anyway.
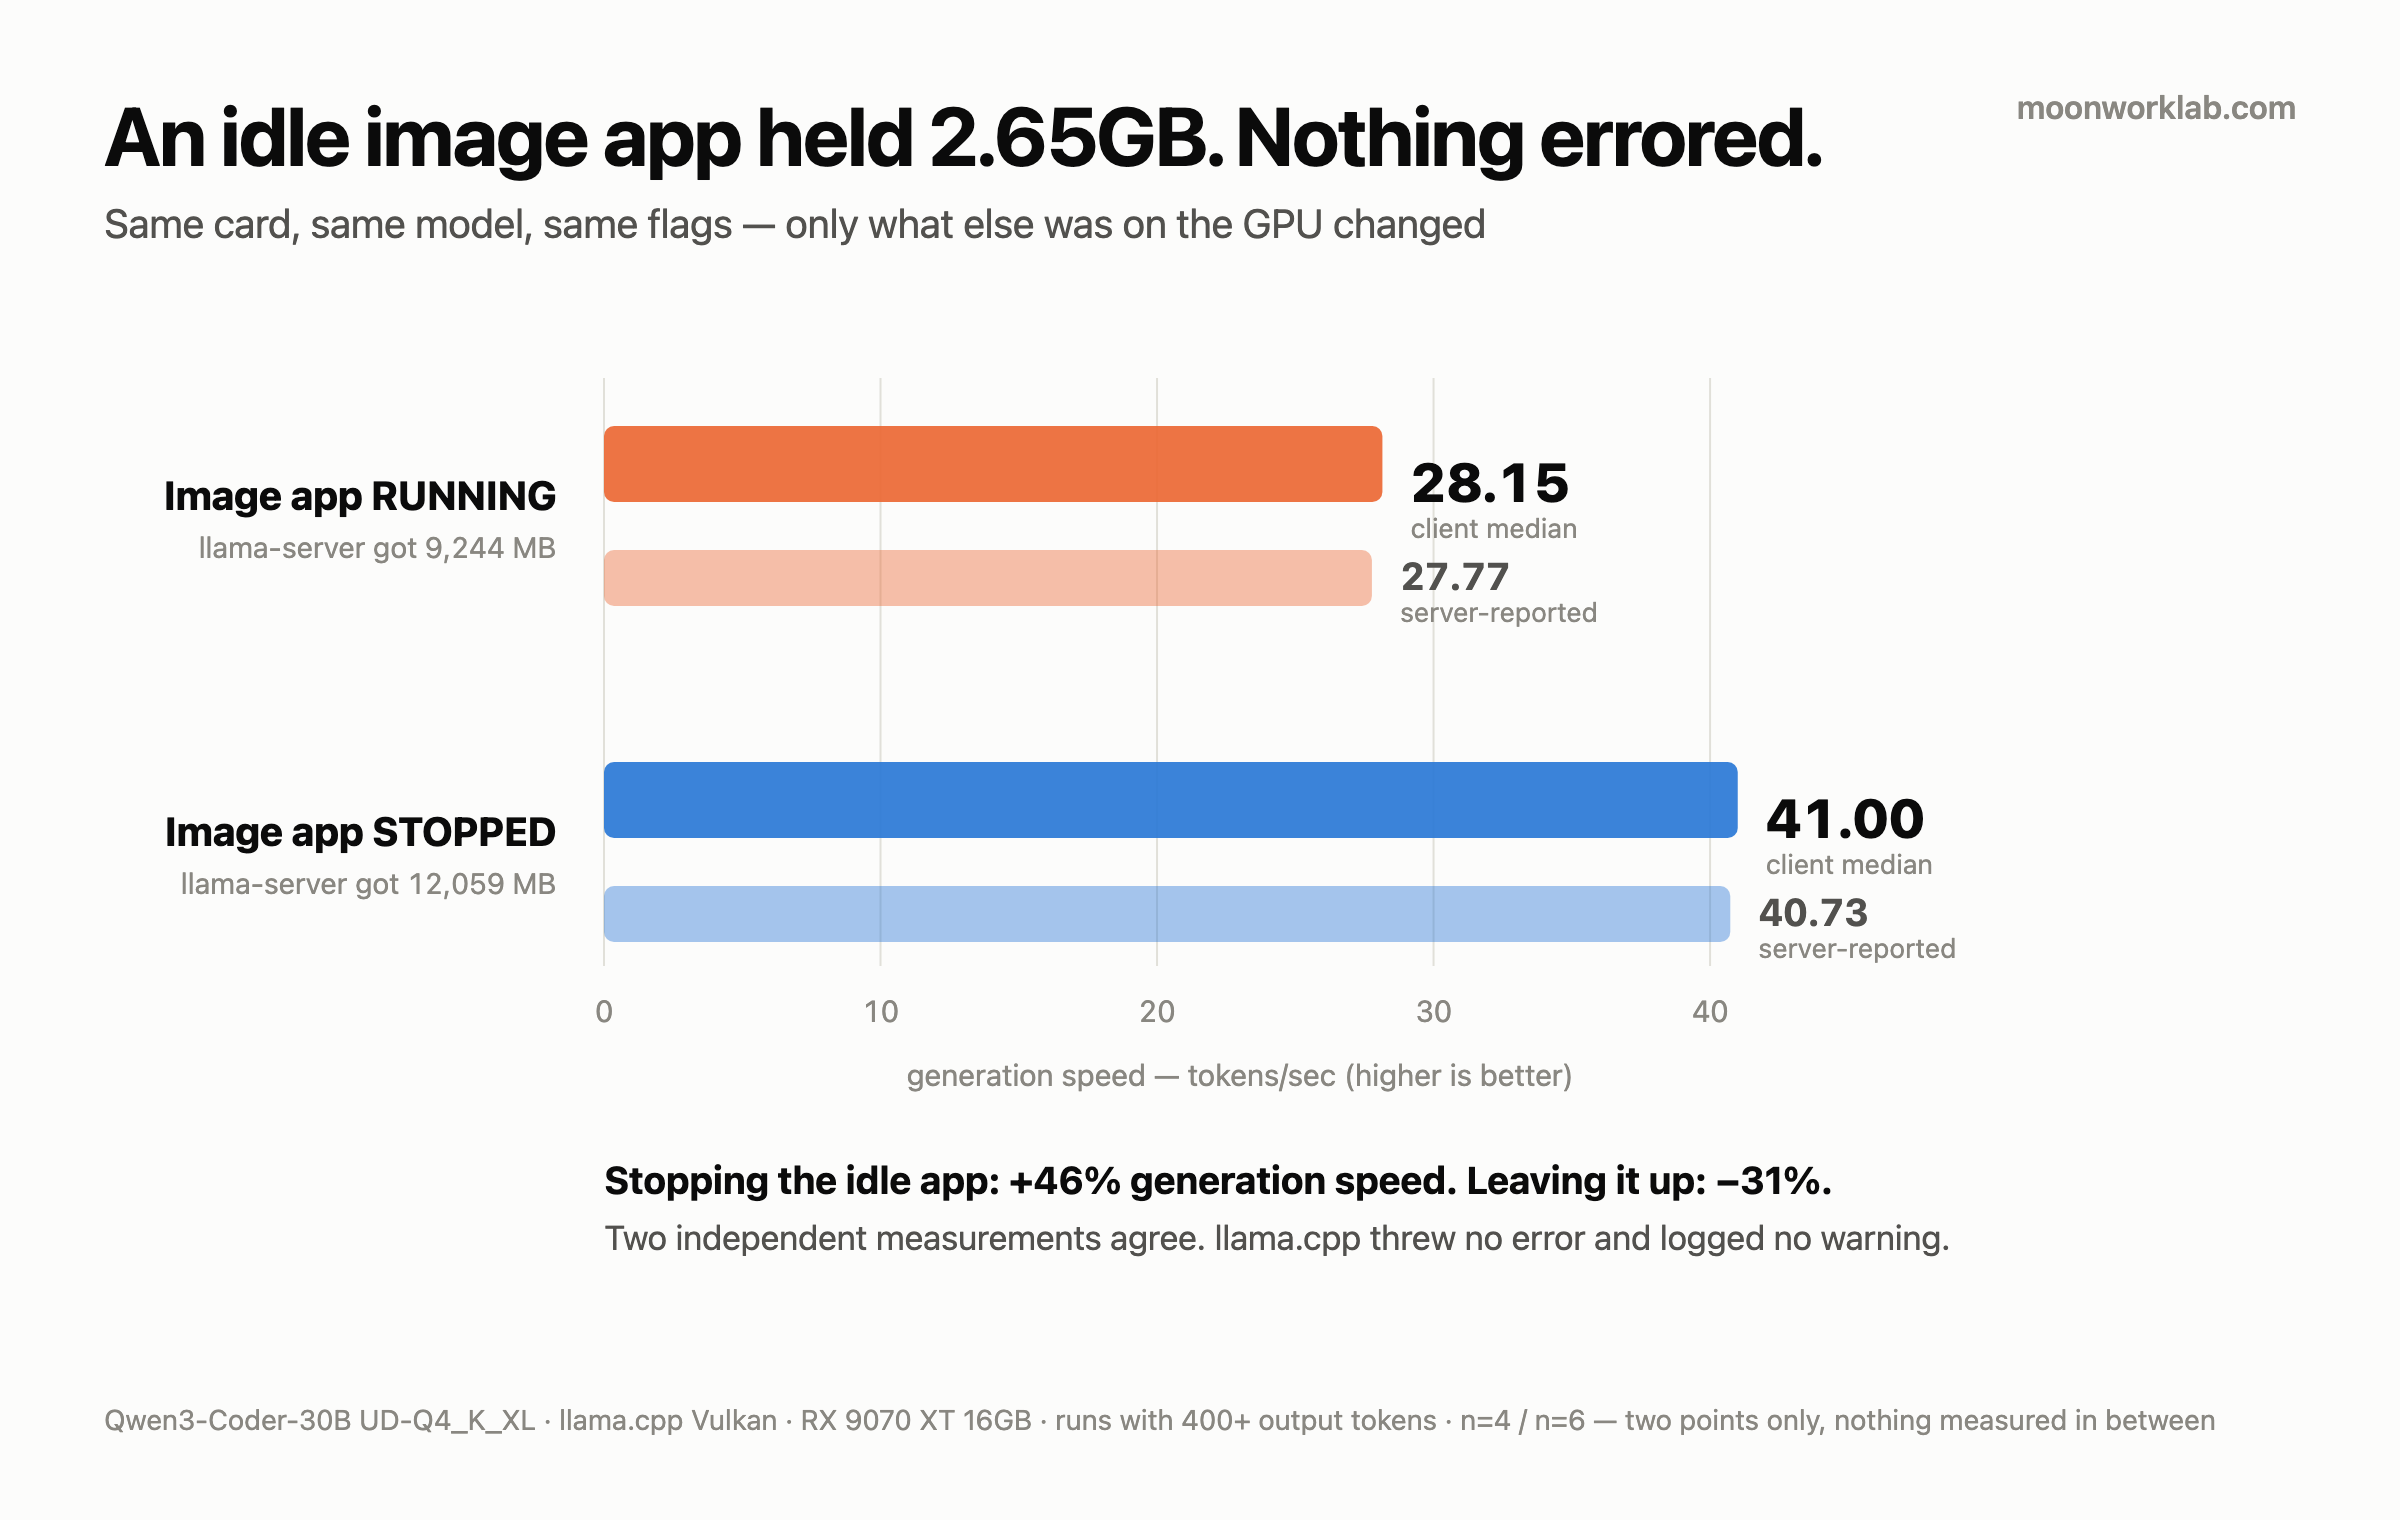
I stopped it and sent the same prompt again. Generation went from 28.2 t/s to 41.0 t/s. I didn’t touch the model file, the quantisation, the flags, the context size, the inference server or the card.
Not one error was thrown. There was no warning in the log either. It was just slow.
This post is the record of measuring those two conditions side by side. It’s also the record of an explanation I’d already published being wrong.
Why I measured again — I’d published something false
In the thirteenth post I wrote that two numbers disagreed: the 41–50 tok/s generation recorded in the ninth post, and the harness wall-clock median of 26.1.
Then I explained it like this.
“41–50 is the generation speed the inference server reports. It times the generation phase.” … “26.1 is wall-clock, measured by the harness: generated tokens ÷ the time from request start to finish. Connection, prompt processing and network all sit inside it.”
It’s a plausible explanation. The problem is I had never measured it. Further down the same section I’d also written: “Which of those ate how many seconds, I never split out.”
I published an explanation I hadn’t measured.
So I added three fields to the harness. Time to first token, the t/s of the generation phase alone, and how long that phase took. The arithmetic is this.
gen t/s = completion_tokens ÷ (total elapsed − TTFT)Then I split it. TTFT wasn’t the culprit. At the median it’s 5.0% in one condition and 6.0% in the other. That’s an order of magnitude short of a 13–15 t/s gap.
The real variable was what else was sitting on the GPU.
This post has a control — and here’s exactly how far it goes
The last two posts had none. The twelfth says “There’s no controlled A/B here.” The thirteenth says “There’s no control group” twice.
This one is different. Exactly one thing differs between the two conditions.
| Item | Value | How I checked |
|---|---|---|
| GPU | RX 9070 XT 16GB | — |
| OS | Windows 11 | — |
| Inference server | llama.cpp llama-server, Vulkan | — |
| Model | Qwen3-Coder-30B-A3B-Instruct UD-Q4_K_XL | read straight off the server’s /props |
| Flags | -ngl 99 --n-cpu-moe 14 -c 16384 --parallel 1 --jinja |
read from the startup config |
| Context | 16384 | /props |
I checked those six lines against the setup table in the ninth post and they all match. Same model, same quantisation, same flags, same backend, same card. I didn’t go from memory — I asked the server.
One line I couldn’t match. The ninth post records the server build number, and I didn’t write it down this time. So this post never claims the builds are identical. The server went down and came back up between A and B, and the two conditions are about thirty minutes apart on the same day. I changed no model, no flag, no context size in between. But a restart sits between my two conditions — that’s a weakness, and it’s in the honest-limits section.
So here’s what this post is allowed to say.
- ✅ It says: on this card, with this model and these flags, one app holding 2.65GB changes generation speed by this much.
- 🚫 It doesn’t say: in general, X GB of free VRAM gives you Y speed. I measured two points. I never looked between them.
- 🚫 It doesn’t say: other apps at other sizes behave the same. One interfering app, one size.
I’ve compared two cards on one model before, in the second post. That one had to admit in its own body that it wasn’t a clean experiment — the backend and the CPU moved too. Here there’s one machine, and the only thing that changes is what else is sitting on the card.
The variable — an idle app holding 2,651MB
Whether an image generation app is up on the same GPU. That’s the whole of it. It ran no jobs the entire time.
| A: image app running | B: image app stopped | |
|---|---|---|
| That app’s dedicated GPU memory | 2,651 MB | 0 |
| llama-server’s dedicated GPU memory | 9,244 MB | 12,059 MB |
I measured it by reading per-process dedicated GPU memory from the Windows performance counters and mapping PIDs to process names.
One line here matters. The flags are identical and llama-server ended up with 2,815MB less.
--n-cpu-moe 14 pins how many layers go to the CPU. That number didn’t change. Neither did -ngl 99. What landed on the card did.
And one more thing — the app was holding 2,651MB but llama-server lost 2,815MB. I don’t know where the other 164MB went. I never measured it.
Results — same prompt, two conditions
The counting rule first. I count runs with 400+ output tokens only, and in A I dropped the probe’s entire first cycle (warm-up). Short runs leave fixed overhead sitting in the denominator, which makes t/s look worse than it is. The thirteenth post already burned me on exactly that.
| A (9,244MB) | B (12,059MB) | Change (A→B) | |
|---|---|---|---|
| wall t/s median | 26.70 | 38.70 | +45% |
| gen t/s median | 28.15 | 41.00 | +46% |
| TTFT median | 1.17s | 0.99s | −15% |
| TTFT as a share of total (median) | 5.0% | 6.0% | — |
| n | 4 | 6 |
I state the direction whenever I use a percentage. 28.15 → 41.00 is +45.6%. Read the same two points the other way, 41.00 → 28.15, and it’s −31.3%. When this post says 46% it means the first direction. The slow side runs at 69% of the fast one.
The trimming didn’t manufacture the result, and here’s the check. Put A’s warm-up cycle back and A’s gen median drops to 27.70, widening the gap to +48.0%. Drop B’s first post-restart run and B falls to 40.50, narrowing it to +43.9%. All four combinations land between +43.9% and +48.0%. I didn’t pick the lowest and I didn’t pick the highest.
One more thing stands out. A’s wall-clock median is 26.70. The harness median printed in the thirteenth post was 26.1. Put them side by side and they sit in the same place. But I can’t confirm those 38 calls ran under condition A — I never recorded what was on the GPU back then. So this isn’t “reproduced.” It’s “two observations landed in the same place.”
I asked the server, not just my client
This is the most important check in the post.
Every t/s above is what my client measured. If the client has a timing bug, the whole table collapses. So I sent a separate non-streaming request and took the generation speed the server reports about itself (timings.predicted_per_second).
| Condition | Server-reported | completion tokens |
|---|---|---|
| A (image app running) | 27.77 t/s | 1,158 |
| B (image app stopped) | 40.73 t/s | 838 |
My client measured 28.15 / 41.00. The server reported 27.77 / 40.73. The two independent paths agree.
So this post doesn’t have to answer “your client just timed it badly.”
The ninth post gets graded here too. What it recorded was 41–50 tok/s generation. This B condition gives a gen median of 41.00, six raw runs between 40.2 and 42.1, and a server report of 40.73. That touches the bottom of the range. The top end, 50, never appeared once — the server’s own 40.73 sits below 41. So what reproduced was the floor of 41–50, not the whole range. Where 50 came from, this measurement can’t say.
Partway through I concluded the ninth post’s number wasn’t reproducing at all. I was wrong. It reproduced fine. I was measuring with the image app switched on.
All ten raw runs
Showing only medians is a way to hide spread. So here’s everything.
A — image app running (llama-server 9,244MB), 4 runs
| Output | Prompt | TTFT | Gen phase | wall t/s | gen t/s |
|---|---|---|---|---|---|
| 468 | 165 | 1.14s | 16.4s | 26.7 | 28.6 |
| 934 | 177 | 1.21s | 33.8s | 26.7 | 27.7 |
| 465 | 165 | 1.14s | 16.3s | 26.7 | 28.6 |
| 970 | 177 | 1.23s | 35.1s | 26.7 | 27.7 |
B — image app stopped (llama-server 12,059MB), 6 runs
| Output | Prompt | TTFT | Gen phase | wall t/s | gen t/s |
|---|---|---|---|---|---|
| 460 | 165 | 2.96s | 11.1s | 32.8 | 41.5 |
| 937 | 177 | 1.01s | 23.2s | 38.7 | 40.4 |
| 468 | 165 | 0.95s | 11.1s | 38.7 | 42.0 |
| 928 | 177 | 0.99s | 22.9s | 38.8 | 40.5 |
| 459 | 165 | 0.95s | 10.9s | 38.7 | 42.1 |
| 949 | 177 | 1.00s | 23.6s | 38.5 | 40.2 |
No hidden rows either, so here’s this. A’s log holds two more runs over 400 tokens — the probe’s first cycle, output 468 (wall 25.3 / gen 27.3) and 959 (wall 26.6 / gen 27.5). They’re warm-up, so they’re out of the table, and putting them back makes A slower. The exclusion cuts against me.
n is small. Four and six. What I have instead is almost no spread inside each condition — all four of A’s wall-clock figures are 26.7, and all six of B’s gen figures fit between 40.2 and 42.1. The two distributions don’t overlap.
Only B’s first run has a TTFT of 2.96 seconds. The other five are 0.95–1.01. Why that one is 3× I never measured — all I know is it was the first request after the server came up. And even that run generated at 41.5 t/s. TTFT tripled and generation speed didn’t move.
TTFT wasn’t the culprit
The thirteenth post pinned the gap on “connection, prompt processing and network” sitting inside wall-clock. All three of those live in front of the first token. So measuring TTFT gives you the ceiling of that explanation.
Median against median, it’s 5.0% in A and 6.0% in B. Run by run it scatters from 3.4% to 21.1%. Shorter outputs push the share up — fixed overhead just looms larger over a short run — and that 21.1% top end is B’s first run. Drop it and B tightens to 4.1–8.1% (median 4.2%). And that 21.1% run still generated at 41.5.
The conclusion holds at every cut. The arithmetic is this: drive TTFT to zero and the wall-clock median becomes the gen median — A rises 26.70 → 28.15, worth 1.45 t/s, and B rises 38.70 → 41.00, worth 2.30 t/s. The gap that needs filling is 13–15 t/s. That’s a different order of magnitude.
Section 7 of the thirteenth post is wrong. I’ve already attached a correction footnote to it. This post is the measurement that footnote points at.
Observation stops here — interpretation starts here
Skip this split and I repeat the thirteenth post’s mistake in this one.
Observed — with the image app holding 2,651MB, llama-server’s dedicated GPU memory fell from 12,059MB to 9,244MB. Under the same conditions generation fell from 41.00 to 28.15 t/s. The server’s own figure moved with it, 40.73 to 27.77. No error and no warning.
My reading — the Vulkan backend spilled what it couldn’t fit into shared system memory, and that stretch lives across PCIe, so generation slowed.
--n-cpu-moe 14pins how many layers go to the CPU but says nothing about what to do when the remaining VRAM falls short. That’s how you get quiet degradation instead of a failure.What I never confirmed — I never watched llama.cpp actually spill to system memory. What I saw is “the allocation shrank” and “the speed dropped.” The sentence joining those two is my reading, not a measurement.
That’s the line I held this time. If you want to state a cause, measure the cause. Not doing that is what produced section 7 of the thirteenth post.
What I got wrong while measuring — all four of them
This part has more reuse value than the numbers.
1. I ran two probes on top of each other.
I thought a background run had died and started a fresh one; the first was still alive. With --parallel 1 the requests queued, and that queue wait landed in TTFT. I got values like 12.9 and 24.4 seconds. I threw the whole dataset out and quarantined it under a name that says it’s contaminated.
One thing survived: gen t/s covers the stretch after the first token, so the queue wait never touched it. That’s why the conclusion held. If I’d only been watching TTFT, the entire measurement would have been lost.
2. I hand-bypassed my own GPU guard.
This machine has a lock that stops the coding model and the image app from using the GPU at once. I started the server directly and skipped that step. The lock read empty while the server was running.
Here’s the funny part. The slow state I worked so hard to produce is the exact state that guard exists to prevent. In the ninth post I’d already written that the coding model couldn’t start at all while image work held the GPU, and that I rewrote the rule on 15 July because of it.
But what I knew then stopped at “the two can’t run at once.” How much slower it gets when they do, I had no idea. The guard wasn’t built on this number. I only saw this number after bypassing the guard.
3. Then I killed the self-healing loop.
The server went down completely. I brought it back through the proper path. That was the price of the bypass.
4. I was looking at the wrong process at first.
Two instances of the image app were running and one of them held no VRAM. The one I checked first was that one. I briefly concluded “this app isn’t using memory.” When two processes share a name, the name tells you nothing.
Don’t do these — I did every one of them
- Don’t write a cause you haven’t measured. I published connection and prompt processing as the reason for the gap. Measured, the stretch containing all three came to 5–6% at the median. I had to correct it with a footnote.
- Don’t benchmark a local model with an image app up on the same GPU. Nothing errors, so you won’t notice. The log was clean and I assumed that was normal speed.
- Don’t assume identical flags mean identical placement. I didn’t change a character of
-ngl 99 --n-cpu-moe 14and 2,815MB less landed on the card. - Don’t run probes concurrently. With
--parallel 1, the second request’s queue wait goes into TTFT in full. I threw away an entire dataset. - Don’t hand-bypass a guard you built yourself. I created a state where the lock read empty while the server ran, and then I killed the self-healing loop.
- Don’t identify a process by name alone. Of two processes sharing a name I checked the one holding no VRAM, and nearly cleared the app on that basis.
- Don’t mix short runs into the same table. Fixed overhead stays in the denominator. That’s why this post counts 400+ output tokens only.
- Don’t conclude something doesn’t reproduce. Partway through I decided the ninth post’s number wasn’t reproducing. It reproduced. What was wrong was my measuring environment.
Honest limits — what this post can’t do
- I tested one interfering program. One app holding 2.65GB. Other sizes and other apps, I never measured.
- I never measured the middle. Whether free VRAM and speed relate linearly or in steps, I don’t know. I have two points.
- n is small. Four and six. The near-zero spread is a consolation, not a large sample.
- Other programs were holding VRAM too. A browser, a game launcher and a driver service came to about 2GB between them. They were up in both conditions, so they aren’t the variable. But what this model does on a card with nothing else on it, I don’t know.
- I only looked at Vulkan. Whether ROCm or CUDA does the same, I never checked.
- I never confirmed the spill to system memory. Exactly as written above. That’s interpretation.
- The ninth post’s VRAM figure and mine come from different tools. That post records
VRAM 15.08GB of 15.9GB; my performance-counter reading for llama-server in B is 12,059MB. Whether those measure the same thing, I never checked. Every VRAM number here is a performance-counter value. - I don’t know which condition the thirteenth post’s 38 calls ran under. I never recorded what was on the GPU then. That’s why this post stops at “they sit in the same place.”
- A server restart sits between my two conditions. I never wrote down the build number, so I can’t rule out that something changed across it.
Closing
Failures that throw errors are easy. They leave a name in the log.
This one threw nothing. The model loaded, every request succeeded, the code came out fine. It just ran at two thirds speed. In that state I ran dozens of units, turned the logs into a table, published it, and attached an explanation I hadn’t measured about where the gap came from.
Fixing it took no new hardware and no new flags. Three extra fields, one app closed, and the same prompt sent ten times.
Next time a local model is slow for no reason, I won’t start with the model. I’ll start with who else is sitting on that card.