The One llama.cpp Flag That Decides Your Speed: Tuning –n-cpu-moe
You can run a 30B model on 16GB of VRAM. But where you put one flag decides whether it’s twice as fast or half as fast.
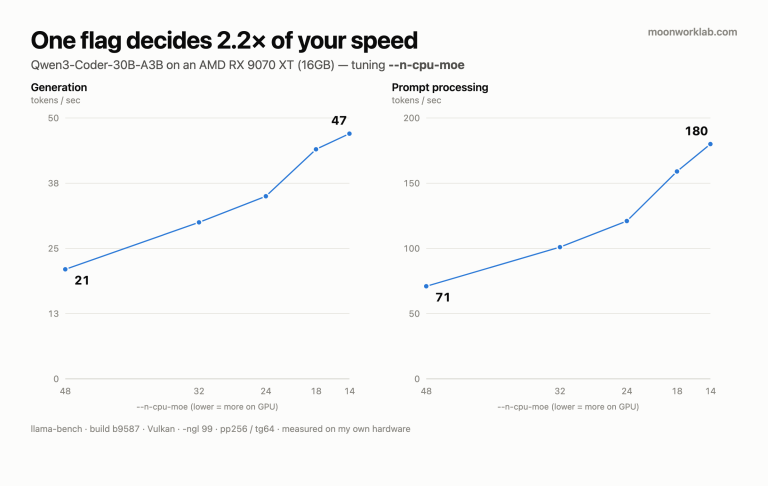
On the same model and the same GPU, I measured anywhere between 21 and 47 tokens/sec. The only thing I changed was a number.
This post is how to find that number — and what happens when you get it wrong, which turns out to be sneakier than it sounds.
Why a 30B fits in 16GB at all: MoE
Qwen3-Coder-30B-A3B is a Mixture of Experts model. 30B parameters total, but only 3B are active for any given token.
The other 27B worth of expert tensors sit idle most of the time. That means parking them in system RAM costs less than you’d expect — and that’s the entire reason a 30B runs on a 16GB card.
A dense model of the same size wouldn’t work. A dense 30B has to read all 30B for every token.
What --n-cpu-moe actually does
The llama.cpp flag does exactly one thing:
--n-cpu-moe Nkeeps the expert tensors of the first N layers in system RAM instead of on the GPU.
- Higher N → less on the GPU → VRAM to spare, but slower
- Lower N → more on the GPU → faster, but VRAM gets tight
So the best setting is as low as you can go before it breaks. The catch: that point differs per card, and you can’t calculate it. You have to measure.
How to measure it
llama.cpp ships with a benchmark tool:
llama-bench -m <model.gguf> -ngl 99 -ncmoe <N> -p 256 -n 64-ngl 99— everything else on the GPU, so-ncmoeis the only variable-p 256— prompt processing (feeding it a long file)-n 64— generation (writing code back out)
Watch both numbers. As you’ll see, they don’t move together.
Run it at descending values of <N> and build a table.
Sweep 1: RX 9070 XT (16GB, 15.4GB usable)
--n-cpu-moe |
Prompt (pp256) | Generation (tg64) |
|---|---|---|
| 48 | 71.26 | 21.15 |
| 32 | 100.88 | 29.61 |
| 24 | 121.06 | 35.46 |
| 18 | 159.38 | 44.49 |
| 14 | 179.71 | 47.42 |
| 13 and below | out of memory | |
Clean. Everything improves as you go down, and it stops at 14. Drop to 13 and it dies. Optimum: 14.
Going 48 → 14 took generation from 21 to 47 tok/s — 2.2×.
I checked the far end too. At --n-cpu-moe 99, with every expert on the CPU, generation fell to 17.9 tok/s.1 So this single flag spans roughly 2.6×.
1 That one came from an interactive session rather than llama-bench, so it isn’t directly comparable to the table. Treat it as a rough floor.
For the full setup behind this card, see the RX 9070 XT write-up.
Sweep 2: RTX 2080 Ti (11GB, 10.1GB usable)
I ran the same sweep on a card with 5GB less memory. This is where it got interesting.
--n-cpu-moe |
Prompt (pp256) | Generation (tg64) |
|---|---|---|
| 48 | 173.09 | 19.62 |
| 42 | 195.80 | 22.91 |
| 36 | 228.05 | 25.31 |
| 32 | 252.76 | 27.51 |
| 28 | 295.38 | 31.15 |
| 26 | 309.53 | 33.09 |
| 24 | 325.55 | 33.07 |
| 22 | 342.69 | 35.97 |
| 20 | 324.49 | 36.71 |
| 18 | 128.11 | 36.88 |
| 16 | 129.17 | 31.98 |
| 14 | 132.73 | 28.87 |
| 12 | 136.31 | 25.78 |
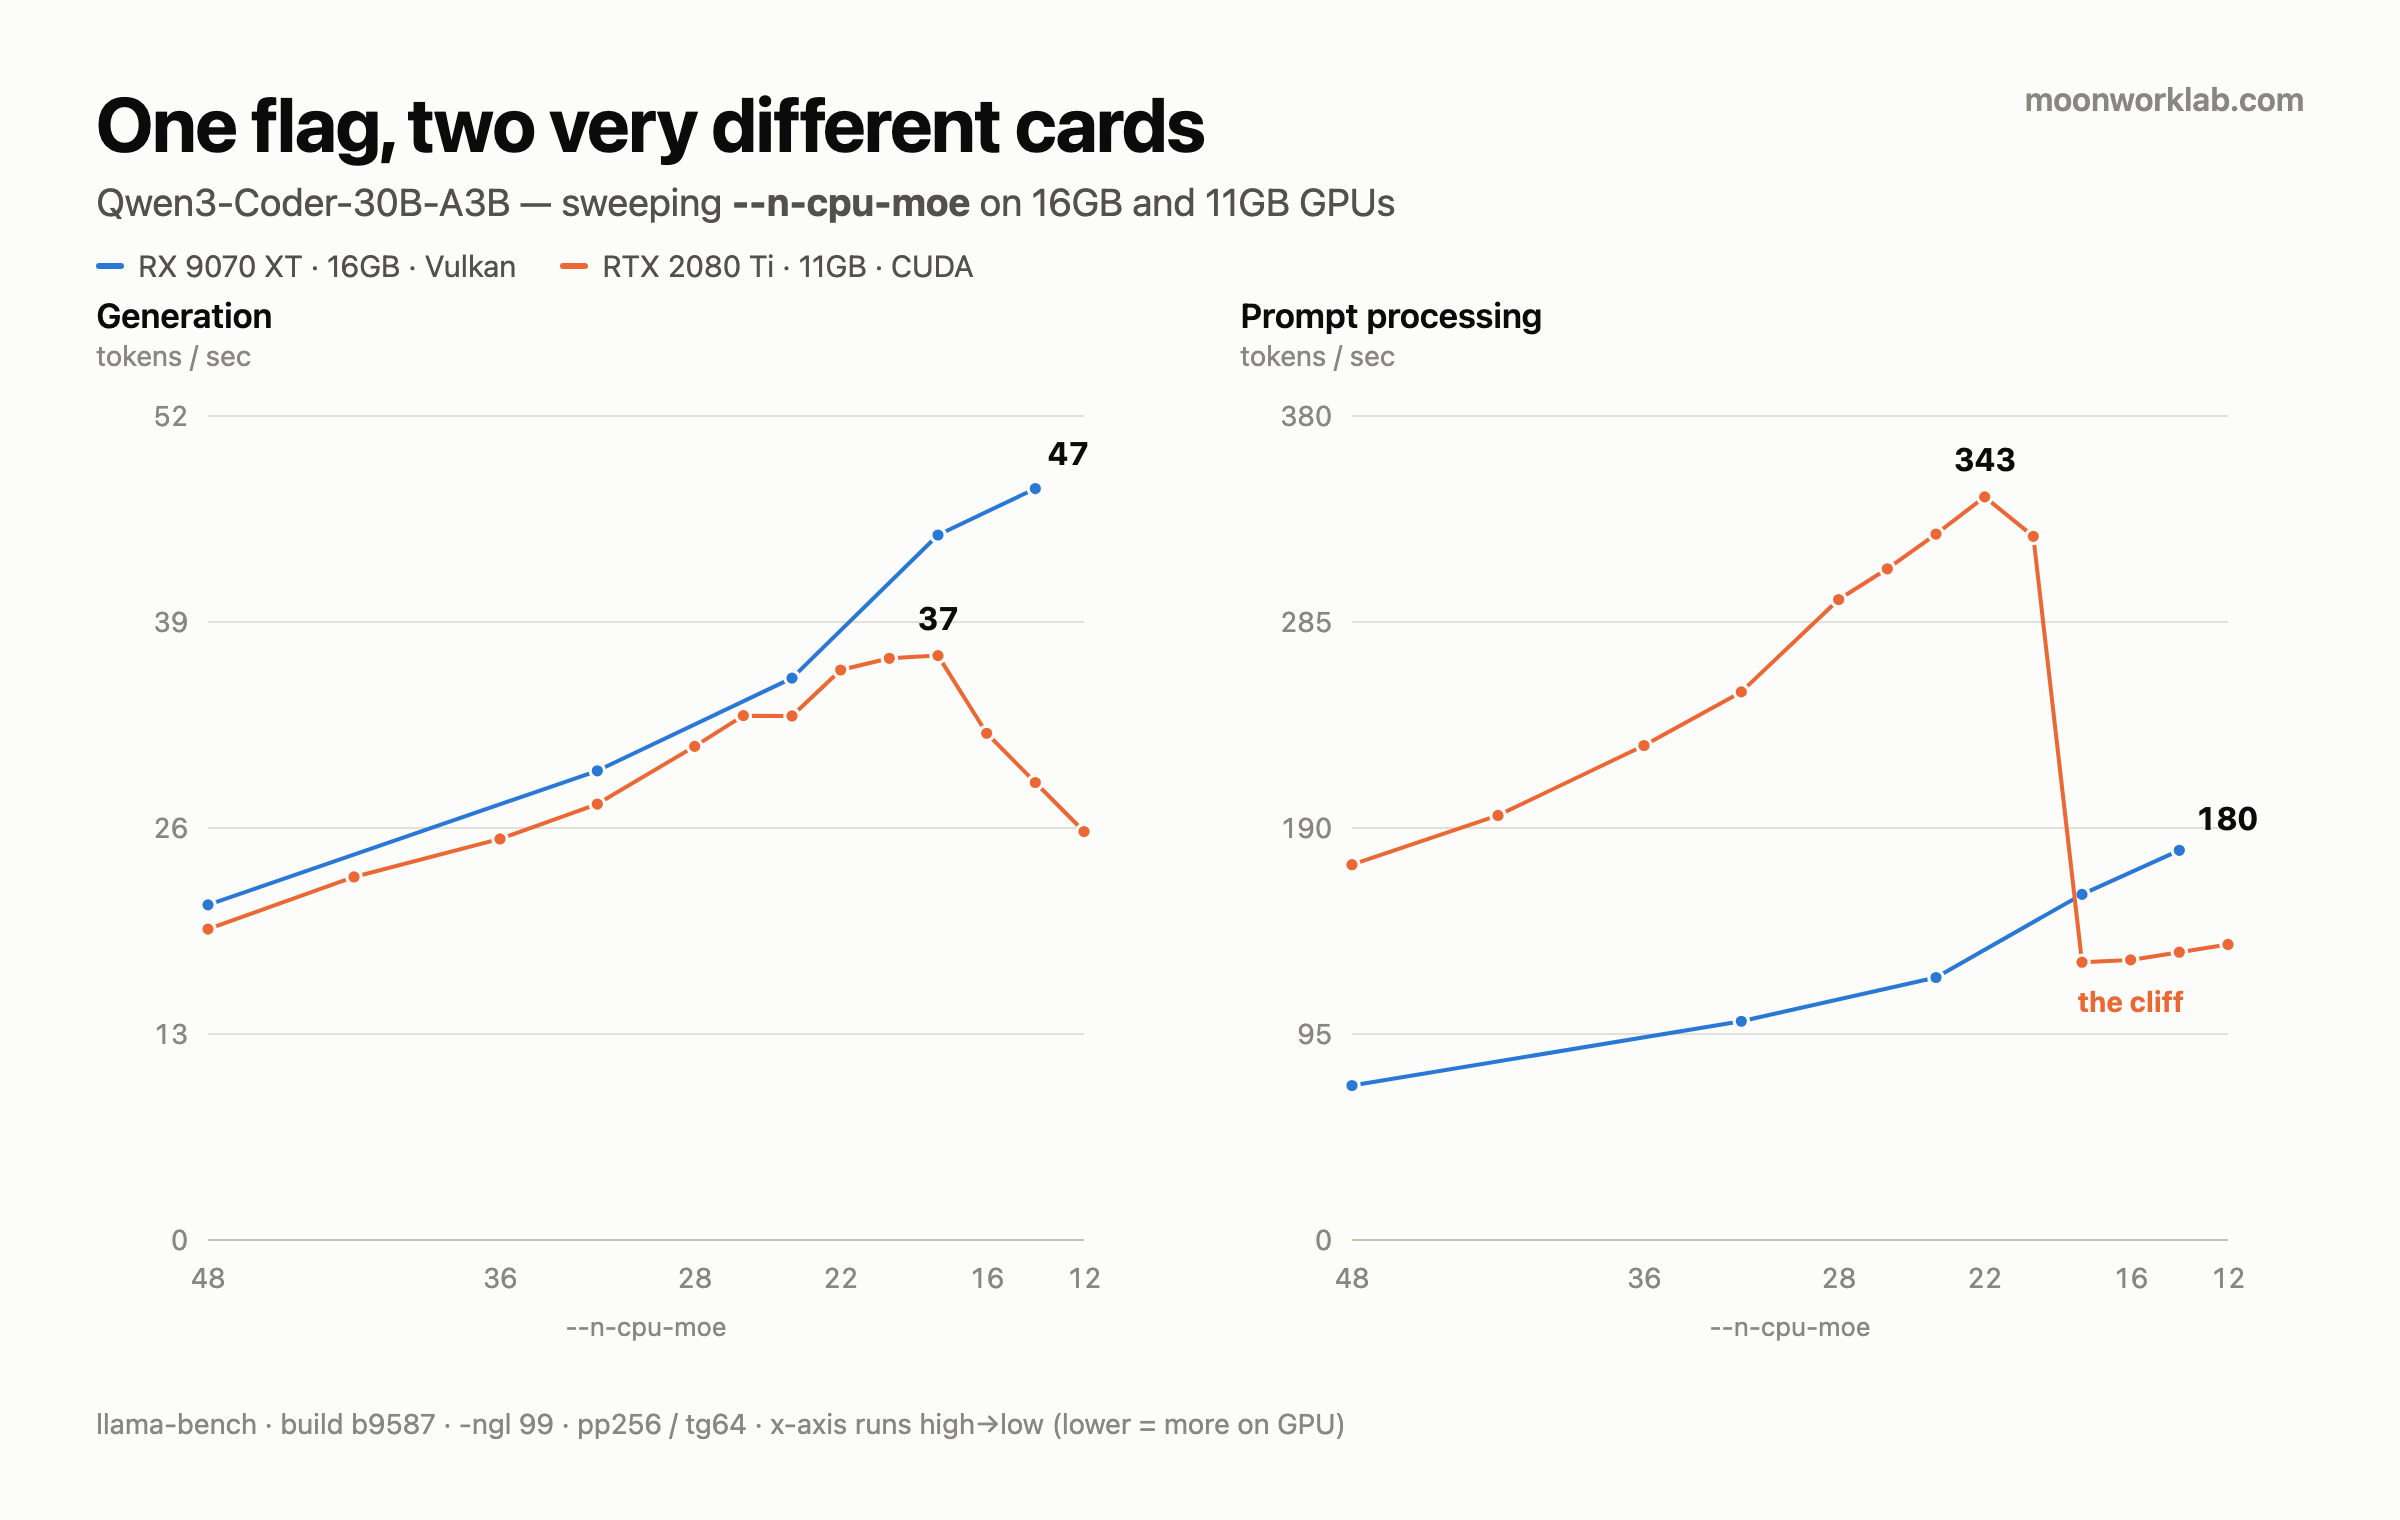
Optimum: 20–22. Now look at what happens underneath that.
The trap: it doesn’t crash, it just gets slower
Getting the second card ready cost me most of an evening — a 16.45GB model download, a CUDA build, then the sweeps. I expected the boring part to be the waiting. It wasn’t.
The AMD card dies when you push past its limit. Out of memory, clear error, no ambiguity. You back off one step and you’re done.
The NVIDIA card never died. Going from 20 to 18 produced this instead:
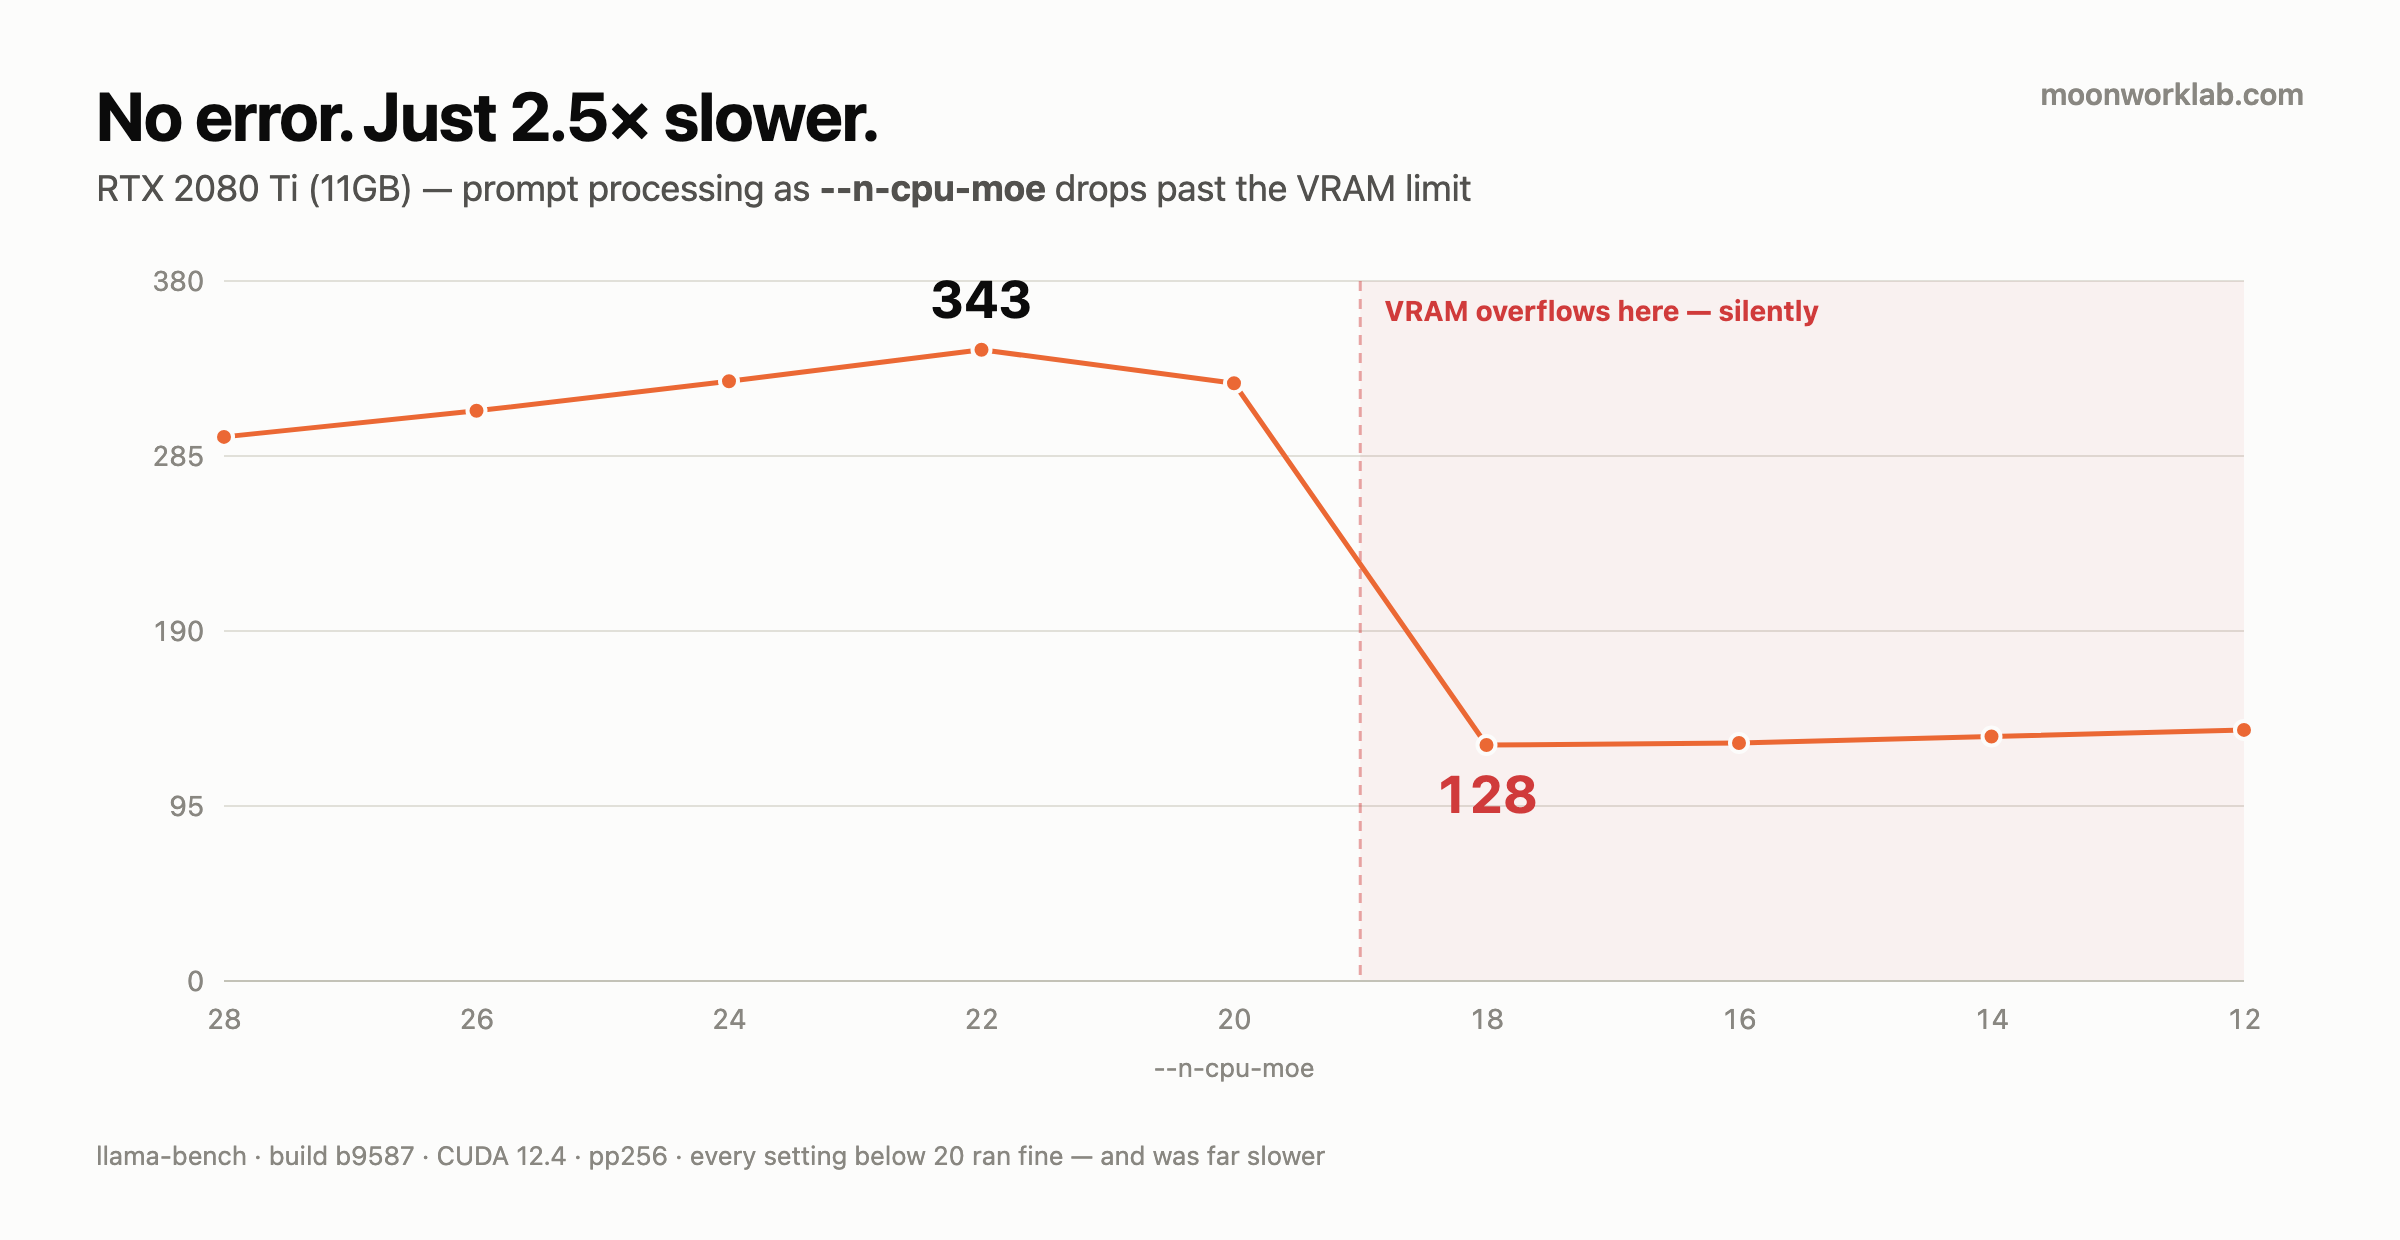
Prompt processing fell 2.5×. Nothing was logged. Nothing failed.
The cause is the NVIDIA driver on Windows. When VRAM runs short it doesn’t error out — it quietly spills into system memory (shared GPU memory). Nothing crashes. It just slows down.
Here’s why that’s a trap: 18, 16, 14 and 12 all work. The model loads, answers come back, everything looks normal. They’re also all far worse than 20. With no crash to tell you, there’s nothing to notice.
The takeaway: on NVIDIA + Windows with tight VRAM, “it runs” and “it runs well” are different questions. You have to measure. AMD is more honest here — when it can’t, it says so.
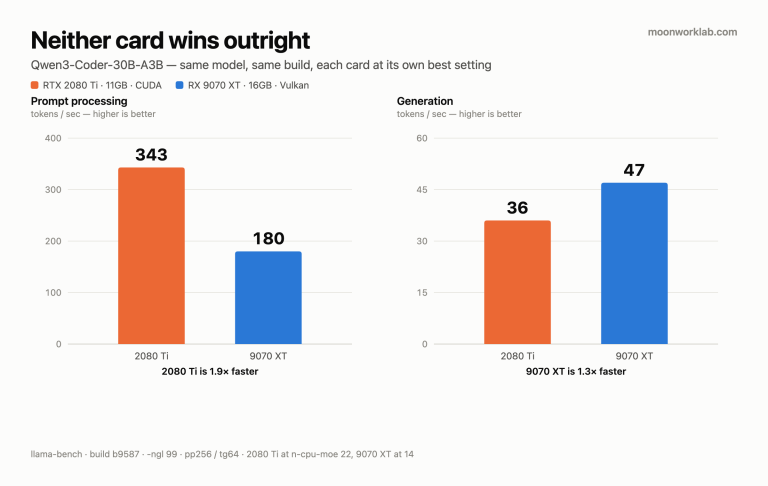
On a 24GB card you’ll never meet this. It only shows up when VRAM is tight. There’s more on how these two cards differ in the head-to-head comparison.
The recipe
This is the loop I ran on both cards:
- Start high. Something like
48— a value you’re confident will load. - Walk it down. Big steps first (48 → 36 → 28), then fine ones once you see gains (26 → 24 → 22 → 20).
- Stop on either signal:
- It runs out of memory → the previous value is your setting.
- Speed drops sharply → that’s the limit too, crash or no crash. The previous value is your setting.
- Read prompt and generation separately. Their optima can differ — on the 2080 Ti it was 22 for prompt, 20 for generation.
- Remember context costs VRAM too. Change the context size and the best setting moves. I measured everything at 16k.
When this isn’t the answer
- If you have VRAM to spare, don’t touch this flag.
--n-cpu-moe 0is fastest. - It does nothing for dense models. This is MoE-only.
- Slow system RAM makes offloading hurt more. Both my machines had 32GB.
- I measured two cards. Don’t copy 14 or 22 — measure yours. The point of this post is the method, not my numbers.
Closing
--n-cpu-moe gets one line in the llama.cpp docs. In practice it’s the biggest lever available to anyone running tight on VRAM.
I found both of my settings with one command:
llama-bench -m <model.gguf> -ngl 99 -ncmoe <N> -p 256 -n 64I’d like to see the table from your card — especially if your VRAM situation differs from mine.