My Local LLM Had Two Speed Numbers. They Answered Different Questions.
I had eight successful requests and two speed columns in the same log. Both looked useful. Neither told me whether the generated code was correct.
The records came from my September 9 VRAM experiment on an RX 9070 XT. I originally used them to compare memory pressure. This time I went back to the unloaded control runs and looked at waiting time.
That’s a narrower question than whether my GPU is fast. I’d been describing generation speed as though it also described how long I’d wait for a usable result. It doesn’t.
The records I actually have
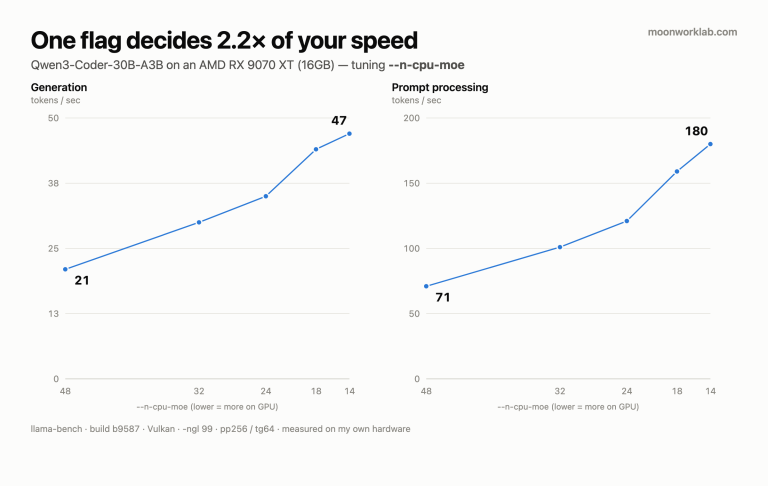
The server ran Qwen3-Coder-30B-A3B-Instruct-UD-Q4_K_XL through llama.cpp’s Vulkan backend on Windows 11. The recorded configuration used CPU expert offload 14, a 16,384-token context, and one parallel slot. These are historical conditions, not my recommendation for every current build.
I have four requests for task A and four for task B. Their prompts contained 209 and 247 tokens respectively. Those aren’t long-context tests. The completed outputs varied even within each task.
| Task and run | Output tokens | Recorded first-token time | Total elapsed | Generation tok/s |
|---|---|---|---|---|
| A1 | 956 | 0.70 s | 23.1 s | 42.7 |
| A2 | 1,048 | 0.11 s | 24.8 s | 42.4 |
| A3 | 903 | 0.12 s | 21.2 s | 42.8 |
| A4 | 1,027 | 0.12 s | 24.3 s | 42.5 |
| B1 | 1,284 | 0.89 s | 31.8 s | 41.5 |
| B2 | 1,425 | 0.14 s | 34.8 s | 41.1 |
| B3 | 1,568 | 0.14 s | 38.6 s | 40.8 |
| B4 | 1,347 | 0.11 s | 32.6 s | 41.4 |
These values are transcribed from the saved JSONL fields. I didn’t rerun the GPU experiment for this article. I also haven’t recovered a pinned copy of the timing harness from that exact run. The first-token column therefore retains its recorded label; it isn’t a new instrumentation validation.
Where the missing time went
Run A1 recorded 22.4 seconds of generation inside 23.1 seconds overall. Dividing 956 output tokens by the total gives about 41.4 tokens per second. Dividing by the generation interval gives about 42.7.
The faster number isn’t false. It excludes part of the wait. I’d lose that distinction if I copied only one speed column into a comparison.
Task B makes a different point. Its generation rates stayed between 40.8 and 41.5 tokens per second, but completion times ranged from 31.8 to 38.6 seconds. The output lengths changed too. I can’t attribute that entire gap to slower hardware.
I haven’t isolated prompt evaluation, transport, scheduling, or cache reuse in these eight records. I won’t rename the first-token field “prompt-processing time.” I don’t have evidence that those are identical intervals.
The first run of each task also had a larger recorded first-token delay. That’s visible. Calling it a cold-start penalty would go further than the records allow. I didn’t control the server’s prior state for that comparison.
What I’d keep in the next result table
I’d keep input length, output length, time to first visible content, and total elapsed together. I’d also keep model identity and the exact server build beside them. A fast stream doesn’t rescue an incorrect patch, so I’d record verification separately.
I wouldn’t mix a 900-token answer with a 1,500-token answer and rank machines solely by completion time. I wouldn’t hide the first run either. If I exclude warm-up requests, that choice needs to be visible before interpreting results.
For an interactive assistant, the first visible response matters. For a code-generation job, completion and review matter too. They’re different waits, and my table needs to preserve both.
Don’t turn this into a long-context benchmark
These prompts were small. I can’t use them to explain a delay at 16k context, recommend a cache setting, or claim one backend fixes slow prompt ingestion. I also can’t count generated files as correct code without checking them.
What I can do is stop making one speed number carry three conclusions. That’s a reporting correction, with the original measurements left intact.
The memory-pressure experiment is covered in my VRAM headroom record. For current server options, I use the llama.cpp server documentation, then record the version I actually run. A current manual doesn’t retroactively change my September results.